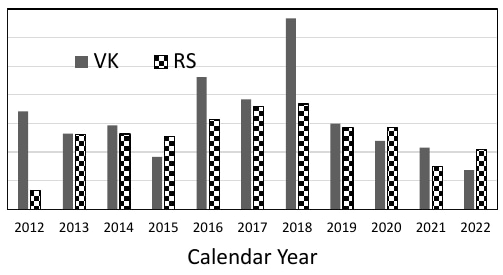
The bar chart gives the batting averages of VK and RS for 11 calendar years…
GATE · 2024 · GE · General AptitudeGATE · 2024 · ME · General AptitudeGATE · 2024 · PH · General Aptitude
The bar chart gives the batting averages of VK and RS for 11 calendar years from 2012 to 2022. Considering that 2015 and 2019 are world cup years, which one of the following options is true?
- A.
RS has a higher yearly batting average than that of VK in every world cup year.
- B.
VK has a higher yearly batting average than that of RS in every world cup year.
- C.
VK’s yearly batting average is consistently higher than that of RS between the two world cup years.
- D.
RS’s yearly batting average is consistently higher than that of VK in the last three years.
Attempted by 1 students.
Show answer
Correct answer: C
Explore the full course: Iocl Engineers Officer Grade A Paper 1
Loading lesson…