Study the charts given below carefully and answer the following questions. Pie…
IBPS · 2021
Study the charts given below carefully and answer the following questions. Pie chart shows the percentage distribution of total students (Science +Commerce) in 12th class of five different Zones and table shows the number of students in same class in science of same zones.
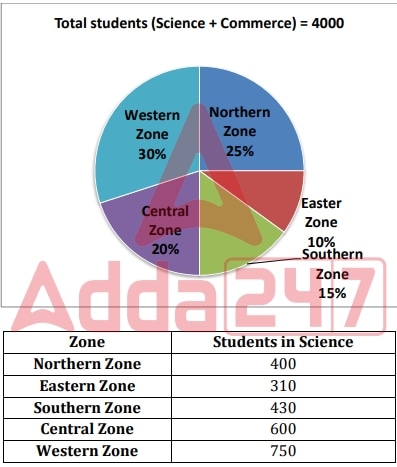
Number of Commerce students in Western zone are how much more than Science students in Northern zone, Eastern zone and Southern zone together.
- A.
660
- B.
770
- C.
630
- D.
730
- E.
690
Attempted by 7 students.
Show answer
Correct answer: E
Loading lesson…