Direction : Study the given graph given below and answer the following…
IBPS · 2018
Direction : Study the given graph given below and answer the following questions
The graph given below shows the percentage of literates in three different villages in three years
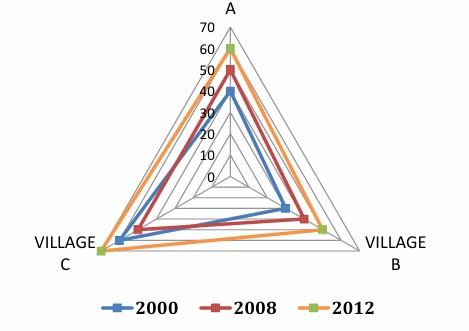
If population of A in 2000, 2008 and 2012 is in ratio 2 : 3 : 4 and average of literate in 2008, 2012 and 2000 be 1410 then find population of village A in 2000.
- A.
1700
- B.
2000
- C.
2100
- D.
1800
- E.
2200
Attempted by 6 students.
Show answer
Correct answer: D
Loading lesson…