Analyse the graph/s given below and answer the question that follows.The…
2025
Analyse the graph/s given below and answer the question that follows.The following graph presents data on the Indian Automobile Industry in various segments. (All figures are in '000s).
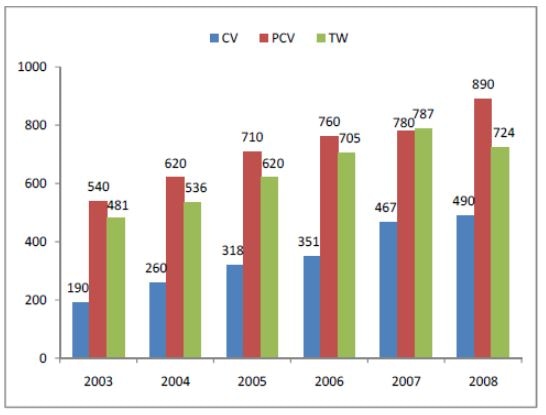
In which segment sales in terms of percentage of the automobile industry has kept on growing year after year?
Answer: C. CV — Concept: When a question asks whether a segment's sales have "kept growing year after year in terms of percentage of the industry", it is asking about that…
- A.
TW
- B.
PCV
- C.
CV
- D.
None of these
Attempted by 7 students.
Show answer & explanation
Correct answer: C
Concept:
When a question asks whether a segment's sales have "kept growing year after year in terms of percentage of the industry", it is asking about that segment's SHARE of total industry sales each year — share = (segment sales that year / total sales of all segments that year) x 100 — not the segment's own year-on-year growth rate. A segment satisfies "kept growing year after year" only if this percentage share rises in every single year shown, without even one dip.
Application:
First find the total automobile industry sales (CV + PCV + TW) for each year directly from the graph:
Year | CV | PCV | TW | Total |
|---|---|---|---|---|
2003 | 190 | 540 | 481 | 1211 |
2004 | 260 | 620 | 536 | 1416 |
2005 | 318 | 710 | 620 | 1648 |
2006 | 351 | 760 | 705 | 1816 |
2007 | 467 | 780 | 787 | 2034 |
2008 | 490 | 890 | 724 | 2104 |
Now compute each segment's percentage share of that year's total:
Year | CV share % | PCV share % | TW share % |
|---|---|---|---|
2003 | 15.69% | 44.59% | 39.72% |
2004 | 18.36% | 43.79% | 37.85% |
2005 | 19.3% | 43.08% | 37.62% |
2006 | 19.33% | 41.85% | 38.82% |
2007 | 22.96% | 38.35% | 38.69% |
2008 | 23.29% | 42.3% | 34.41% |
CV's share rises in every single year without exception (15.69% -> 18.36% -> 19.3% -> 19.33% -> 22.96% -> 23.29%). PCV's share falls continuously from 2003 to 2007 (from 44.59% down to 38.35%) and only recovers in 2008, while TW's share falls, then rises, then falls again — both break the "every year" condition partway through the period.
Cross-check:
Re-verify the two years where CV's share increase is smallest (2005 to 2006): 318/1648 = 19.3% and 351/1816 = 19.33%, confirming the rise holds even across the tightest year-to-year gap. Since PCV and TW each reverse direction at least once while CV never does, CV is the only segment whose share of total industry sales grows every year.