Analyse the graph/s given below and answer the question that follows.The…
2025
Analyse the graph/s given below and answer the question that follows.The following graph presents data on the Indian Automobile Industry in various segments. (All figures are in '000s).
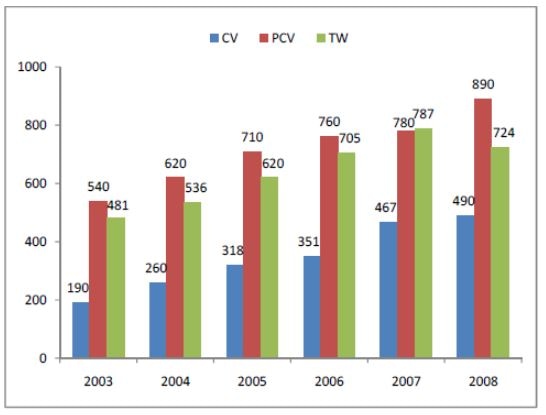
The only segment which has ever shown a negative growth during the period under review is
Answer: A. TW — Concept: Growth for a time series is judged year-over-year: a segment shows negative growth in the year where its value is lower than its own value in the…
- A.
TW
- B.
PCV
- C.
CV
- D.
None of these
Attempted by 7 students.
Show answer & explanation
Correct answer: A
Concept:
Growth for a time series is judged year-over-year: a segment shows negative growth in the year where its value is lower than its own value in the immediately preceding year. To find the segment with negative growth here, compare each segment's value across every consecutive pair of years in the 2003–2008 range — not just compare segments against each other within the same year.
Application:
Reading the bar values by year:
Year | CV | PCV | TW |
|---|---|---|---|
2003 | 190 | 540 | 481 |
2004 | 260 | 620 | 536 |
2005 | 318 | 710 | 620 |
2006 | 351 | 760 | 705 |
2007 | 467 | 780 | 787 |
2008 | 490 | 890 | 724 |
CV rises every year (190 → 260 → 318 → 351 → 467 → 490) and PCV rises every year (540 → 620 → 710 → 760 → 780 → 890) — neither ever dips below its own previous year's value. TW rises from 481 in 2003 to 787 in 2007, then falls to 724 in 2008 — a year-over-year decrease.
Cross-check:
Scanning every consecutive year-pair across all three segments, the 787 → 724 fall (2007 to 2008) is the only decrease anywhere in the dataset — confirming that only one segment ever shows negative growth over the period.
Hence, TW is the segment that shows negative growth.