Analyse the graph/s given below and answer the question that follows.The…
2023
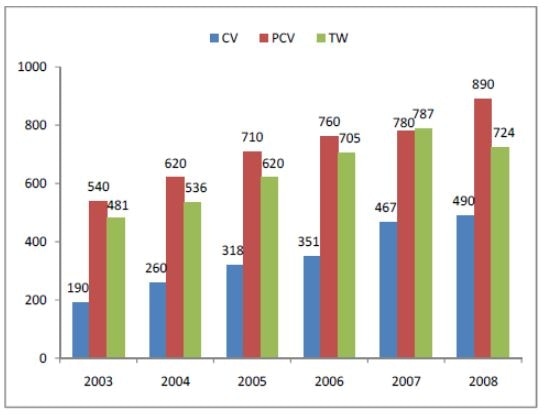
Analyse the graph/s given below and answer the question that follows.The following graph presents data on the Indian Automobile Industry in various segments. (All figures are in '000s). The segment having sales growth higher than the overall sales growth of the industry over the previous year, in each of the years shown, is
Answer: C. CV — Year-on-year percentage growth = ((Value in current year - Value in previous year) / Value in previous year) x 100. To find which segment grew faster than the…
- A.
TW
- B.
PCV
- C.
CV
- D.
None of these
Attempted by 1 students.
Show answer & explanation
Correct answer: C
Year-on-year percentage growth = ((Value in current year - Value in previous year) / Value in previous year) x 100. To find which segment grew faster than the industry as a whole, compute the OVERALL growth (sum of all three segments) for each year, compute each segment's OWN growth for the same year, and compare them year by year - the segment whose growth rate stays above the overall rate in every year is the one with growth consistently higher than the industry's overall growth.
Add TW + PCV + CV for every year to get the industry total (all figures in '000s): 2003 = 1211, 2004 = 1416, 2005 = 1648, 2006 = 1816, 2007 = 2034, 2008 = 2104.
Compute the overall year-on-year growth from these totals: 2004 = (1416-1211)/1211 x 100 = 16.93%; 2005 = (1648-1416)/1416 x 100 = 16.38%; 2006 = (1816-1648)/1648 x 100 = 10.19%; 2007 = (2034-1816)/1816 x 100 = 12.00%; 2008 = (2104-2034)/2034 x 100 = 3.44%.
Compute each segment's own year-on-year growth the same way, from its own bar values, for every year.
Compare each segment's growth against the overall growth figure for the same year.
Year | Overall Growth | CV Growth | PCV Growth | TW Growth |
|---|---|---|---|---|
2004 | 16.93% | 36.84% | 14.81% | 11.43% |
2005 | 16.38% | 22.31% | 14.52% | 15.67% |
2006 | 10.19% | 10.38% | 7.04% | 13.71% |
2007 | 12.00% | 33.05% | 2.63% | 11.63% |
2008 | 3.44% | 4.93% | 14.10% | -8.01% |
Checking column by column: CV's growth rate is above the overall rate in all five years (2004-2008). PCV's own growth crosses the overall rate only once, in 2008, and trails it in every other year. TW's own growth crosses the overall rate only once, in 2006, and even turns negative in 2008. So only one segment stays above the overall growth rate throughout the period.
CV is the segment whose sales growth is higher than the overall sales growth of the industry over the previous year, in every year shown.