The bar graph below shows the percentage distribution of the total expenditure…
2024
The bar graph below shows the percentage distribution of the total expenditure of a company under various expense heads during 2003.
Percentage Distribution of Total Expenditure of a Company
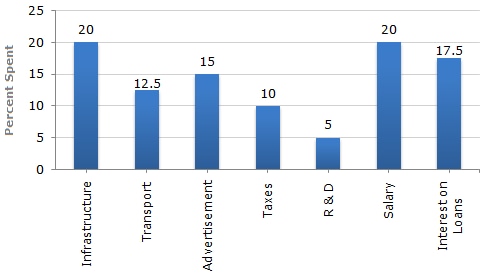
The total expenditure of the company is how many times the expenditure on Research and Development (R & D)?
Answer: B. 20 — Concept: In a percentage-distribution bar graph, when a total quantity is split into shares across categories, the number of times the total is of any one…
- A.
27
- B.
20
- C.
18
- D.
8
Attempted by 5 students.
Show answer & explanation
Correct answer: B
Concept: In a percentage-distribution bar graph, when a total quantity is split into shares across categories, the number of times the total is of any one category equals 100 divided by that category's own percentage share, since category value = (percentage ÷ 100) × total.
Application
From the bar graph, the expenditure on Research and Development (R & D) is 5% of the total expenditure.
Let the total expenditure be x. Then R & D expenditure = 5% of x = x × (5/100) = x/20.
So, Total expenditure ÷ R & D expenditure = x ÷ (x/20) = 20.
Hence, the total expenditure is 20 times the expenditure on R & D.
Cross-check: All seven percentage shares shown in the graph add up to 100% (20 + 12.5 + 15 + 10 + 5 + 20 + 17.5 = 100), confirming the R & D share of 5% used above is read correctly from the graph.