Out of the two bar graphs given below, one shows the amount (in Rs. Lakhs)…
2023
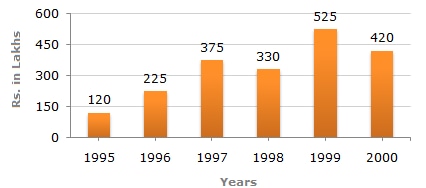
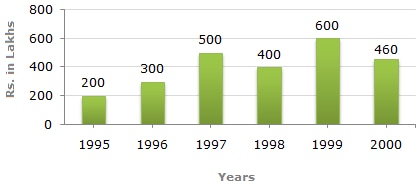
Out of the two bar graphs given below, one shows the amount (in Rs. Lakhs) invested by a company in purchasing raw materials over the years, and the other shows the value (in Rs. Lakhs) of finished goods sold by the company over the years.
Amount invested in Raw Materials (Rs. in Lakhs)
Value of Sales of Finished Goods (Rs. in Lakhs)
The maximum difference between the amount invested in raw materials and the value of sales of finished goods was during the year:
- A.
1995
- B.
1996
- C.
1997
- D.
1998
Show answer & explanation
Correct answer: C
CONCEPT: For twin bar-graph "difference" questions, read the two values plotted for each category directly from the bars, subtract to get the gap for that category, then compare every gap to identify the required one (here, the maximum).
APPLICATION: Reading the two graphs year by year gives:
Year | Raw Material (Rs. Lakh) | Sales (Rs. Lakh) | Difference (Rs. Lakh) |
|---|---|---|---|
1995 | 120 | 200 | 80 |
1996 | 225 | 300 | 75 |
1997 | 375 | 500 | 125 |
1998 | 330 | 400 | 70 |
1999 | 525 | 600 | 75 |
2000 | 420 | 460 | 40 |
The largest of these gaps, Rs. 125 lakh, occurs in 1997.
CROSS-CHECK: Among all six years plotted, the 1997 pair of bars (raw material 375 vs sales 500) is the most widely separated pair on the chart — no other year's sales bar sits as far above its raw-material bar — which independently confirms 125 lakh as the largest gap.
Hence, the maximum difference between the amount invested in raw materials and the value of sales of finished goods was during 1997.