Out of the two bar graphs provided below, one shows the amounts (in Lakh Rs.)…
2025
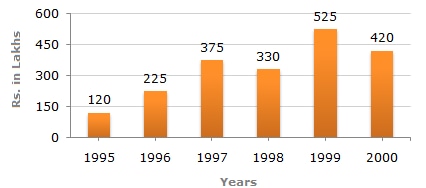
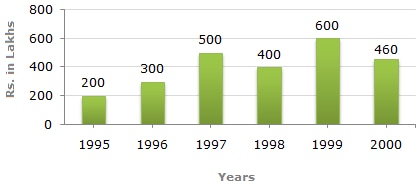
Out of the two bar graphs provided below, one shows the amounts (in Lakh Rs.) invested by a Company in purchasing raw materials over the years and the other shows the values (in Lakh Rs.) of finished goods sold by the Company over the years.
Amount invested in Raw Materials (Rs. in Lakhs)
Value of Sales of Finished Goods (Rs. in Lakhs)
In which year, the percentage change (compared to the previous year) in the investment on Raw materials is same as that in the value of sales of finished goods?
- A.
1996
- B.
1997
- C.
1998
- D.
1999
Attempted by 1 students.
Show answer & explanation
Correct answer: B
Concept: The percentage change compared to the previous year is calculated as:
Percentage Change = [(This year's value − Previous year's value) / Previous year's value] × 100
The year we need is the one where this percentage change works out to the same value for both the raw-material investment and the finished-goods sales.
Application: Reading the two bar graphs and applying the formula year by year:
Year | % Change in Raw-Material Investment | % Change in Finished-Goods Sales |
|---|---|---|
1996 | 87.5% | 50% |
1997 | 66.67% | 66.67% |
1998 | −12% | −20% |
1999 | 59.09% | 50% |
2000 | −20% | −23.33% |
Cross-check: Comparing the two percentage-change columns row by row, only the 1997 row has equal entries on both sides (66.67% = 66.67%); every other row has two different values, so no other year qualifies.
Hence, 1997 is the year in which the percentage change in the investment on raw materials matches the percentage change in the value of sales of finished goods.