Out of the two bar graphs provided below, one shows the amounts (in Lakh Rs.)…
2023
Out of the two bar graphs provided below, one shows the amounts (in Lakh Rs.) invested by a Company in purchasing raw materials over the years, and the other shows the values (in Lakh Rs.) of finished goods sold by the Company over the years.
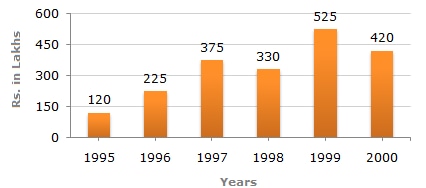
Amount invested in Raw Materials (Rs. in Lakhs)
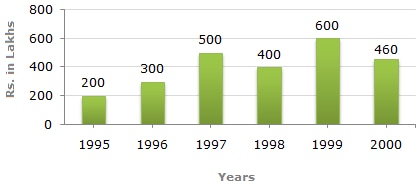
Value of Sales of Finished Goods (Rs. in Lakhs)
The value of sales of finished goods in 1999 was approximately what percent of the sum of amount invested in Raw materials in the years 1997, 1998 and 1999?
- A.
33%
- B.
37%
- C.
45%
- D.
49%
Show answer & explanation
Correct answer: D
Concept: To express one quantity as a percentage of another (or of a sum of several quantities), use Percentage = (Part ÷ Whole) × 100. When the 'whole' is built by adding several bars from a graph, first read every required bar accurately, add them to form the base, and only then apply this formula to the specified part.
Data read from the two graphs:
Year | Raw material invested (Rs. Lakhs) | Sales of finished goods (Rs. Lakhs) |
|---|---|---|
1995 | 120 | 200 |
1996 | 225 | 300 |
1997 | 375 | 500 |
1998 | 330 | 400 |
1999 | 525 | 600 |
2000 | 420 | 460 |
Application:
Sales of finished goods in 1999 (from the second graph) = 600 lakh — this is the required 'part'.
Raw material investment for 1997 = 375 lakh, for 1998 = 330 lakh, and for 1999 = 525 lakh (from the first graph).
Sum of these three years' raw material investment = 375 + 330 + 525 = 1230 lakh — this is the required 'whole'.
Required percentage = (600 ÷ 1230) × 100 = 48.78%.
Rounding to the nearest whole number gives approximately 49%.
Cross-check: Half of 1230 is 615; since 600 is only a little below 615, the share should be a little below 50%, which agrees with 49%.
Result: The value of sales of finished goods in 1999 was approximately 49% of the raw material investment for 1997, 1998 and 1999.