The bar graph given below shows the data of the production of paper (in lakh…
2023
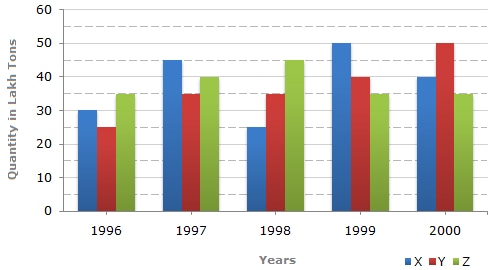
The bar graph given below shows the data of the production of paper (in lakh tonnes) by three different companies X, Y and Z over the years. Production of Paper (in lakh tonnes) by Three Companies X, Y and Z over the Years.
What is the ratio of the average production of Company X in the period 1998-2000 to the average production of Company Y in the same period?
- A.
1:1
- B.
15:17
- C.
23:25
- D.
27:29
Attempted by 2 students.
Show answer & explanation
Correct answer: C
Concept: The average of a set of values equals their sum divided by the count of values. When two quantities are averaged over the SAME number of periods, the ratio of their averages equals the ratio of their sums (the common divisor cancels), so the sums for 1998, 1999 and 2000 can be compared directly.
Application: Reading the bar graph for the years 1998, 1999 and 2000:
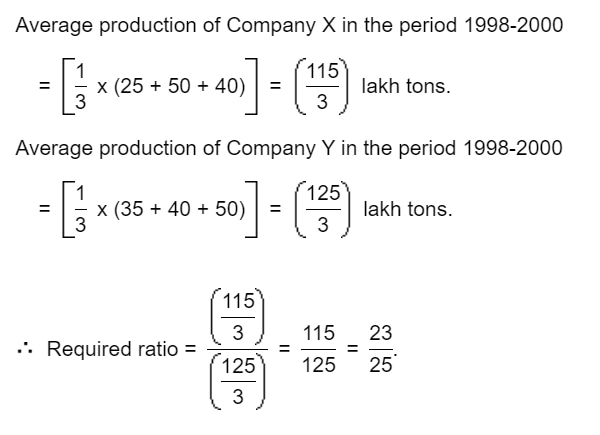
Company X's production was 25, 50 and 40 lakh tonnes in 1998, 1999 and 2000 respectively, so its 1998-2000 sum = 25 + 50 + 40 = 115 lakh tonnes and average = 115/3 lakh tonnes.
Company Y's production was 35, 40 and 50 lakh tonnes in 1998, 1999 and 2000 respectively, so its 1998-2000 sum = 35 + 40 + 50 = 125 lakh tonnes and average = 125/3 lakh tonnes.
Required ratio = (115/3) : (125/3) = 115 : 125. Dividing both terms by their HCF, 5, gives 23 : 25.
Cross-check: 23 x 125 = 2875 and 25 x 115 = 2875 — the cross-products match, confirming 23 : 25 is the fully reduced, correct ratio.