The multi-level hierarchical pie chart shows the population of animals in a…
GATE · 2014 · EC · Set 3 · General Aptitude
The multi-level hierarchical pie chart shows the population of animals in a reserve forest. The
correct conclusions from this information are:
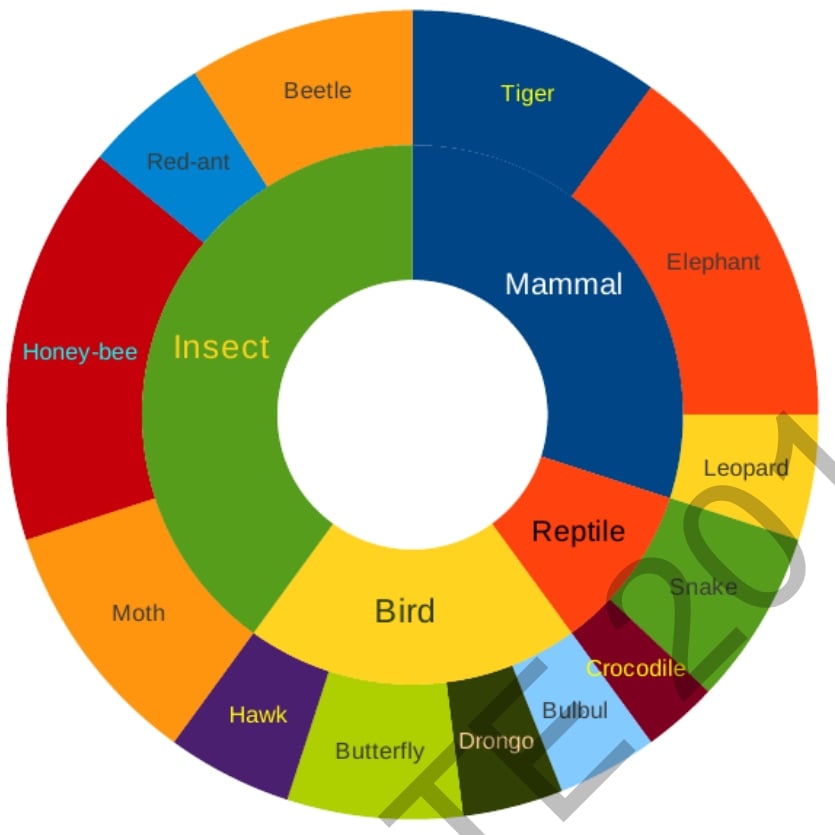
(i) Butterflies are birds
(ii) There are more tigers in this forest than red ants
(iii) All reptiles in this forest are either snakes or crocodiles
(iv) Elephants are the largest mammals in this forest
- A.
(i) and (ii) only
- B.
(i), (ii), (iii) and (iv)
- C.
(i), (iii) and (iv) only
- D.
(i), (ii) and (iii) only
Sign up free to check your answer
Sign up freeLoading lesson…