The monthly distribution of 9 Watt LED bulbs sold by two firms X and Y from…
GATE · 2020 · CE · Set 2 · General AptitudeModified — slightly modified from the official paper; see the solution
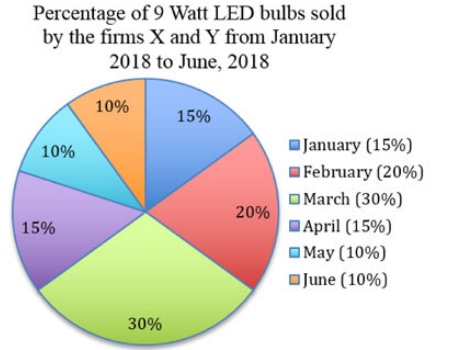
The monthly distribution of 9 Watt LED bulbs sold by two firms X and Y from January to June 2018 is shown in the pie-chart and the corresponding table. If the total number of LED bulbs sold by two firms during January-June 2018 is 50000, then the number of LED bulbs sold by the firm Y during April-June 2018 is_____.
Month | Ratio of LED bulbs sold by two firms (X : Y) |
|---|---|
January | 7 : 8 |
February | 2 : 3 |
March | 2 : 1 |
April | 3 : 2 |
May | 1 : 4 |
June | 9 : 11 |
- A.
11250
- B.
9750
- C.
8750
- D.
8250
Sign up free to check your answer
Sign up freeLoading lesson…