Which one of the following plots represents \(f(x)=-\frac{|x|}{x}\), where…
GATE · 2025 · BM · General AptitudeGATE · 2025 · EC · General AptitudeGATE · 2025 · EY · General AptitudeGATE · 2025 · GE · General AptitudeGATE · 2025 · XH · General Aptitude
Which one of the following plots represents , where is a non-zero real number? Note: The figures shown are representative.
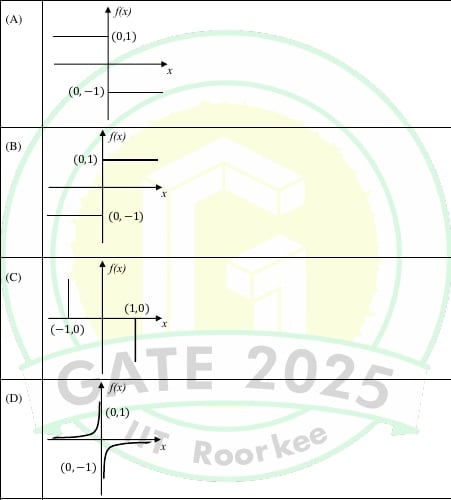
- A.
Plot A
- B.
Plot B
- C.
Plot C
- D.
Plot D
Sign up free to check your answer
Sign up freeLoading lesson…