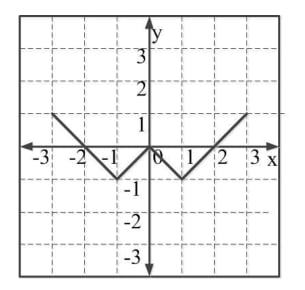
Which of the following functions describe the graph shown in the below figure?
GATE · 2018 · ME · Set 1 · General Aptitude
Which of the following functions describe the graph shown in the below figure?
- A.
y = ||x| + 1| − 2
- B.
y = ||x| − 1| − 1
- C.
y = ||x| + 1| − 1
- D.
y = ||x − 1| − 1|
Attempted by 1 students.
Sign up free to check your answer
Sign up freeLoading lesson…