Directions for questions: The percentage distribution of households by…
2025
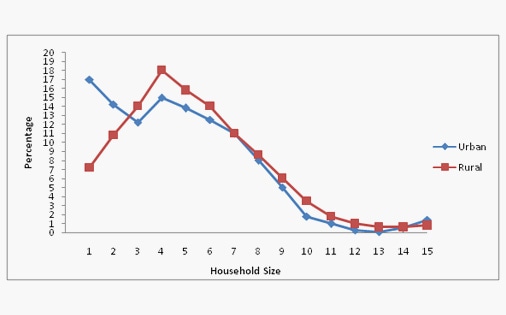
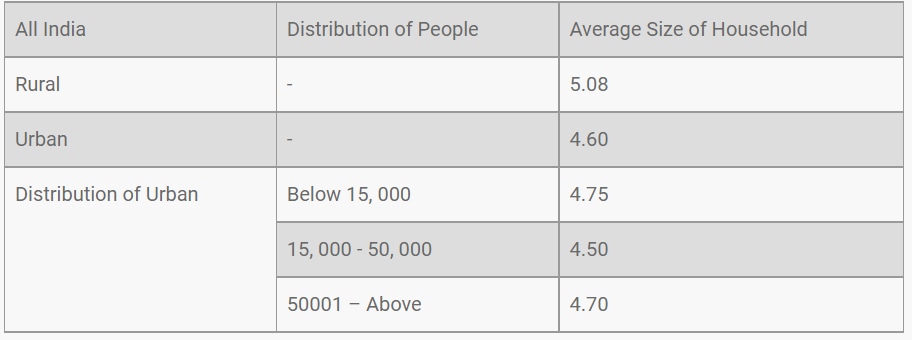
Directions for questions: The percentage distribution of households by household size, and the average sizes of households in All India Rural and Urban areas classified as per population size, are presented below.
In rural areas, per 100 households, there were 31 households of size:
Answer: C. 3 or less — Concept: In a line graph showing a percentage distribution by category (here, household size), the cumulative percentage for "size X or less" is found by…
- A.
13 or less
- B.
7 or less
- C.
3 or less
- D.
4 or less
Attempted by 1 students.
Show answer & explanation
Correct answer: C
Concept: In a line graph showing a percentage distribution by category (here, household size), the cumulative percentage for "size X or less" is found by adding up the individual percentage values plotted for every category from the smallest size up to and including X.
Application: Reading the rural (red) line in the graph and summing the values for the smallest household sizes:
Household size 1 (rural): approximately 8%.
Household size 2 (rural): approximately 11%.
Household size 3 (rural): approximately 12%.
Cumulative for "size 3 or less": 8% + 11% + 12% = 31%, which matches the 31-per-100 figure given in the question.
Cross-check: Checking the other cumulative ranges confirms no other option also totals 31%:
"4 or less" adds the peak value at size 4 (~18%), giving roughly 49% -- too high.
"7 or less" and "13 or less" include still more of the curve, pushing the cumulative total to roughly 89% and close to 100% respectively -- both far too high.
So the range that gives exactly 31% is household size 3 or less.