Directions for questions 9 to 11: Refer to the graph given below and answer…
2023
Directions for questions 9 to 11: Refer to the graph given below and answer the questions given after that accordingly.
The graph given shows price variation of three types of wood over 1987 – 1993 in Rs/m3. 1 ton = 1000 kg and 1m3 = 800 kg.
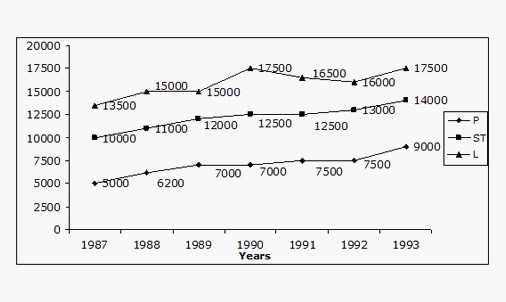
Maximum increase in price/ m3 for any product for any two consecutive years was in which of the products?
Answer: B. L — ConceptIn a line graph tracking a quantity year by year, the increase over two consecutive years is the difference between the later year's value and the…
- A.
P
- B.
L
- C.
ST
- D.
R
Attempted by 2 students.
Show answer & explanation
Correct answer: B
Concept
In a line graph tracking a quantity year by year, the increase over two consecutive years is the difference between the later year's value and the earlier year's value. "Maximum increase for any two consecutive years" means: for each series, scan every adjacent year-pair, take the largest positive difference, then compare those per-series maxima across all series and pick the biggest one.
Application
Read each plotted series from the graph and find its single largest jump between adjacent years:
P (5000, 6200, 7000, 7000, 7500, 7500, 9000): the biggest adjacent jump is 7500 to 9000 = 1500 (1992 to 1993).
ST (10000, 11000, 12000, 12500, 12500, 13000, 14000): the biggest adjacent jump is 1000 (e.g. 1987 to 1988, 10000 to 11000).
L (13500, 15000, 15000, 17500, 16500, 16000, 17500): the biggest adjacent jump is 15000 to 17500 = 2500 (1989 to 1990).
Cross-check
Comparing the per-series maxima: 1500 (P), 1000 (ST) and 2500 (L). The largest of these is 2500, achieved by L. (R is not plotted on the graph, so it has no values to compare.) Hence the product with the maximum price increase over any two consecutive years is L.