Directions for questions 9 to 11: Refer to the graph given below and answer…
2024
Directions for questions 9 to 11: Refer to the graph given below and answer the questions given after that accordingly.
The graph given shows price variation of three types of wood over 1987 – 1993 in Rs/m3. 1 ton = 1000 kg and 1m3 = 800 kg.
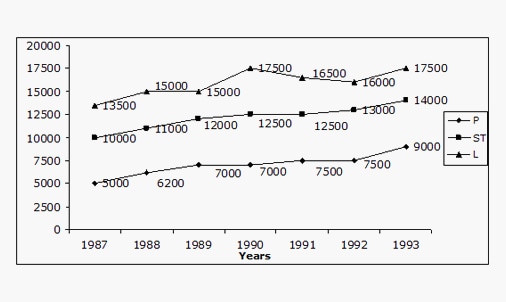
Which of the following has shown maximum %age change in its value over any two consecutive years?
Answer: B. P — Step-by-Step SolutionTo find the maximum percentage change over any two consecutive years, we calculate the growth for each wood type (P, ST, L)…
- A.
ST
- B.
P
- C.
L
- D.
M
Attempted by 2 students.
Show answer & explanation
Correct answer: B
Step-by-Step Solution
To find the maximum percentage change over any two consecutive years, we calculate the growth for each wood type (P, ST, L) year-over-year.
Understand the Formula: The percentage change is calculated as:
((Value_CurrentYear - Value_PreviousYear) / Value_PreviousYear) * 100.Analyze the Data Points (Approximation):
Wood Type P (Circle Marker):
1987: 5000, 1988: 6200 -> Change = ((6200-5000)/5000) * 100 = 24%
1988: 6200, 1989: 7000 -> Change = ((7000-6200)/6200) * 100 = ~12.9%
Wood Type ST (Square Marker):
1987: 10000, 1988: 11000 -> Change = ((11000-10000)/10000) * 100 = 10%
1988: 11000, 1989: 12000 -> Change = ((12000-11000)/11000) * 100 = ~9.1%
Wood Type L (Triangle Marker):
1987: 13500, 1988: 15000 -> Change = ((15000-13500)/13500) * 100 = ~11.1%
Conclusion: Comparing the calculated percentage changes, the growth of Wood Type P between 1987 and 1988 (approximately 24%) is the highest observed change in the graph.