Directions: The table and line graph below give the average size of households…
2023
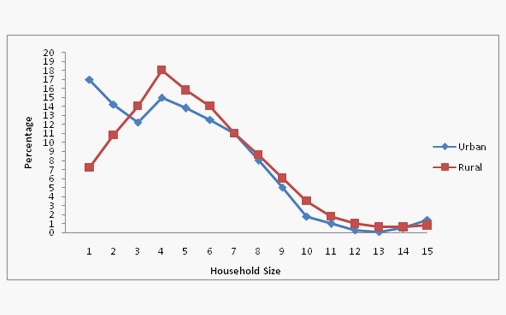
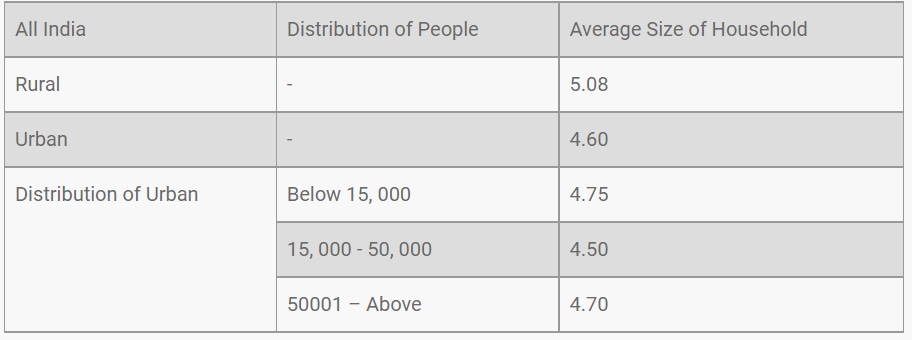
Directions: The table and line graph below give the average size of households and the percentage distribution of households by household size, for All India Rural and Urban areas. Urban areas are further classified by population size.
Which one of the following statements is true?
Answer: D. In urban areas, there are 460 persons on an average per 100 households. — Concept: The "average size of household" for a group is defined as the total number of persons in that group divided by the total number of households in that…
- A.
On the average there are more persons per family in urban areas than in rural areas.
- B.
In rural areas, 35 per cent of the households are of the size 7 and above.
- C.
In urban areas, the average size of the household is the least for towns.
- D.
In urban areas, there are 460 persons on an average per 100 households.
Attempted by 1 students.
Show answer & explanation
Correct answer: D
Concept: The "average size of household" for a group is defined as the total number of persons in that group divided by the total number of households in that group. Rearranging this identity gives: persons per N households = average size multiplied by N. So an average figure can be converted directly into an exact "persons per 100 households" statement without needing any other data.
From the table, the average size of an urban household is 4.60.
Apply the identity: persons per 100 urban households = 4.60 × 100 = 460.
This matches the statement about 460 persons per 100 urban households exactly, so that statement is true.
Check the statement about urban having more persons per family than rural: the table gives the rural average as 5.08, which is higher than the urban average of 4.60 -- so persons per family are not higher in urban areas; that statement reverses the comparison and is false.
Check the statement about towns having the least average size: among the urban population-size categories, the average household size is 4.75 (below 15,000), 4.50 (15,000 to 50,000), and 4.70 (50,001 and above). The least value, 4.50, belongs to the middle category, not to the smallest towns category (4.75); so that statement is false.
Check the statement about 35 per cent of rural households being of size 7 and above: reading the rural curve gives roughly 11% (size 7), 8-9% (size 8), 6-7% (size 9), about 4% (size 10), and about 1-2% each for sizes 11 through 15 -- an approximate running total in the mid-30s, but every one of those readings carries a point or two of visual-estimation error, so the total cannot be pinned to exactly 35 per cent with the same certainty as a table-based figure.
Cross-check: total persons ÷ total households = average, so total persons = average × total households, that is, 4.60 × 100 = 460 -- consistent with the result above.
The statement that 460 persons on average live in every 100 urban households follows from an exact identity in the table (average size × 100) and holds unconditionally regardless of any graph reading. Since this question format allows only one statement to be true, and this one is already proven true beyond doubt, it must be the intended answer -- the urban-versus-rural comparison and the towns claim are directly contradicted by the table, and the rural-graph reading for size 7-and-above cannot be pinned to an exact, independently verifiable value the way this one can. Therefore, the true statement is: "In urban areas, there are 460 persons on an average per 100 households."