Directions : The graph given below shows the daily income of 50 workers in a…
2025
Directions : The graph given below shows the daily income of 50 workers in a factory.
Study the graph and answer the questions.
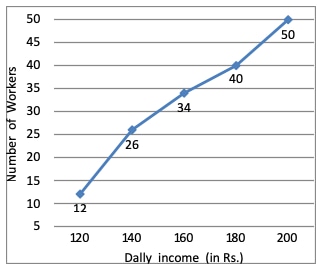
The median wages in the factory is:
Answer: B. Rs. 138 — Step-by-Step SolutionTo find the median wage, we identify the income value corresponding to the middle worker in the dataset. Understand the Graph: The X-axis…
- A.
Rs. 140
- B.
Rs. 138
- C.
Rs. 150
- D.
Rs. 160
Attempted by 9 students.
Show answer & explanation
Correct answer: B
Step-by-Step Solution
To find the median wage, we identify the income value corresponding to the middle worker in the dataset.
Understand the Graph:
The X-axis represents Daily Income (in Rs.).
The Y-axis represents the Cumulative Number of Workers.
The graph shows a total of 50 workers.
Locate the Median Position:
For a set of 50 workers, the median position is the average of the 25th and 26th worker.
Mathematically, this is the position at (N / 2) = 50 / 2 = 25.
Find the Corresponding Income:
Look for the value 25 on the Y-axis (Number of Workers).
Trace horizontally from 25 to the graph line.
Trace vertically down from that point to the X-axis (Daily Income).
The intersection point on the X-axis falls between 120 and 140, specifically closer to 140. Given the curve's trajectory, the median value is approximately Rs. 138.