Direction: Observe the graph below and answer the following questions. What is…
2025
Direction: Observe the graph below and answer the following questions.
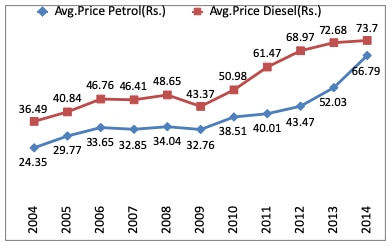
What is the average of petrol prices over the years 2006 - 2012?
Answer: A. 36.47 — The average (arithmetic mean) of a set of values equals the sum of all the values divided by the number of values. When the data is shown as points on a line…
- A.
36.47
- B.
37.34
- C.
35.67
- D.
38.77
Attempted by 2 students.
Show answer & explanation
Correct answer: A
The average (arithmetic mean) of a set of values equals the sum of all the values divided by the number of values. When the data is shown as points on a line graph, first read off each required data point accurately, then apply this formula directly.
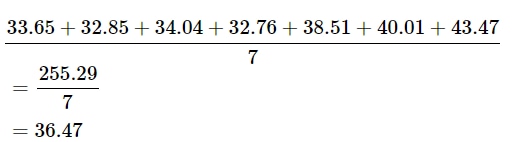
Read the blue-line (petrol) prices for each year from 2006 to 2012 off the graph: 33.65, 32.85, 34.04, 32.76, 38.51, 40.01, and 43.47 (Rs.).
Sum these 7 values: 33.65 + 32.85 + 34.04 + 32.76 + 38.51 + 40.01 + 43.47 = 255.29.
Divide the sum by the number of years, 7: 255.29 ÷ 7 = 36.47.
As a check, 36.47 sits within the range of the seven values (32.76 to 43.47) and close to the lower-middle years, which is expected since four of the seven years (2006-2009) cluster near 33-34 while only 2011-2012 pull the mean higher — confirming 36.47 is a reasonable mean rather than a computational slip.