Directions : The graph given below shows the daily income of 50 workers in a…
2024
Directions : The graph given below shows the daily income of 50 workers in a factory. Study the graph and answer the questions.
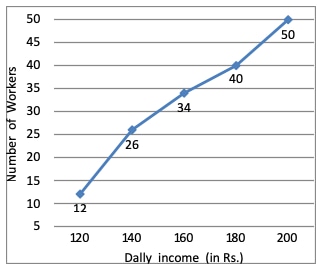
What percentage of the factory workers earn between Rs. 140 and Rs. 160?
Answer: B. 16% — Concept: In a “less than” cumulative frequency graph (ogive), the y-value plotted at any income level gives the number of workers earning up to that amount.…
- A.
6%
- B.
16%
- C.
12%
- D.
20%
Attempted by 2 students.
Show answer & explanation
Correct answer: B
Concept: In a “less than” cumulative frequency graph (ogive), the y-value plotted at any income level gives the number of workers earning up to that amount. The number of workers in a specific income bracket equals the difference between the cumulative values at the two ends of that bracket, and turning that count into a percentage of the workforce requires dividing by the total number of workers and multiplying by 100.
Application:
Read the cumulative number of workers at Rs. 140 and at Rs. 160 directly off the graph: 26 and 34 respectively.
Workers earning between Rs. 140 and Rs. 160 = 34 − 26 = 8.
Percentage of the 50 workers shown on the graph = (8 / 50) × 100 = 16%.
Cross-check: The remaining bracket counts read off the same curve — 12 (up to Rs. 120), 14 (Rs. 120–140), 6 (Rs. 160–180) and 10 (Rs. 180–200) — add up to 12 + 14 + 8 + 6 + 10 = 50, the total number of workers on the graph, confirming the readings are consistent.