Direction: Observe the graph below and answer the following questions. In…
2023
Direction: Observe the graph below and answer the following questions.
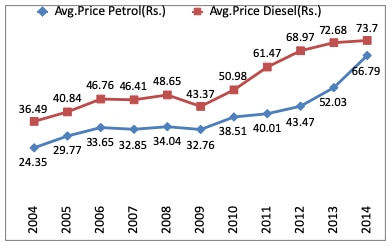
In which year the difference between average prices of petrol and Diesel is minimum?
Answer: C. 2014 — Concept: When a question asks for the year with the minimum (or maximum) difference between two data series on a graph, compute the difference (larger value −…
- A.
2005
- B.
2009
- C.
2014
- D.
2004
Attempted by 2 students.
Show answer & explanation
Correct answer: C
Concept: When a question asks for the year with the minimum (or maximum) difference between two data series on a graph, compute the difference (larger value − smaller value) between the two series for each year being compared, then compare those differences to find the smallest (or largest) one.
Application: For the four years given in the options, read off the Diesel and Petrol values from the graph and compute the difference (Diesel − Petrol):
Year | Diesel (Rs.) | Petrol (Rs.) | Difference (Rs.) |
|---|---|---|---|
2004 | 36.49 | 24.35 | 12.14 |
2005 | 40.84 | 29.77 | 11.07 |
2009 | 43.37 | 32.76 | 10.61 |
2014 | 73.7 | 66.79 | 6.91 |
Cross-check: This also matches the graph visually — the blue (Petrol) and red (Diesel) lines are closest together in 2014, confirming the numeric gap there is the smallest.
Since Rs. 6.91 is the smallest of the four differences, the year with the minimum difference between average petrol and diesel prices is 2014.