Directions for questions : The following diagram shows the percentage share of…
2023
Directions for questions : The following diagram shows the percentage share of manufacturing sector in total employment in small, medium and large establishments individually. The definitions of small, large and medium establishments are shown below in the diagram
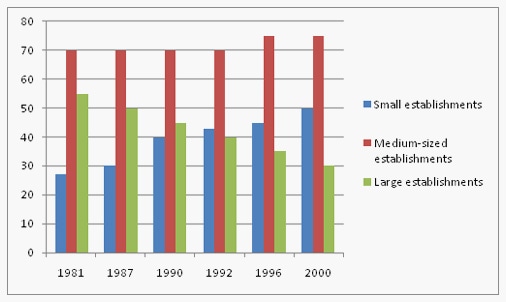
Small establishments are defined as those with fewer than 100 employees. Medium-sized establishments are defined as those with between 100 and 1500 employees. Large establishments are defined as those with more than 1500 employees. Study the diagram carefully and answer the questions given below:
Which of the following is/are correct?
I. Share of manufacturing employment in small establishment is rising steadily.
II. In large establishments there is growing unemployment.
Answer: A. I only — In a data-interpretation question built on a chart, first identify exactly which variable is plotted before judging any statement -- a chart of employment…
- A.
I only
- B.
II only
- C.
I and II
- D.
Neither I nor II
Attempted by 1 students.
Show answer & explanation
Correct answer: A
In a data-interpretation question built on a chart, first identify exactly which variable is plotted before judging any statement -- a chart of employment share says nothing about unemployment, income, or absolute headcount; a statement can only be judged true if it matches the axis and legend actually shown.
Read the blue Small establishments bars year by year: about 27% in 1981, 30% in 1987, 40% in 1990, 42.5% in 1992, 45% in 1996, and 50% in 2000.
Each successive value is higher than the one before it, with no dip anywhere on the timeline, so the share is rising steadily -- Statement I matches the chart exactly.
Read the green Large establishments bars: about 55% in 1981, 50% in 1987, 45% in 1990, 40% in 1992, 35% in 1996, and 30% in 2000 -- a steady decline in share.
Statement II claims growing unemployment, but the chart's vertical axis and legend measure percentage share of manufacturing employment, not an unemployment rate. A shrinking share of employment in large establishments is consistent with several different underlying employment scenarios and cannot, by itself, establish that unemployment is growing.
Year | Small establishments (% share) | Large establishments (% share) |
|---|---|---|
1981 | 27 | 55 |
1987 | 30 | 50 |
1990 | 40 | 45 |
1992 | 42.5 | 40 |
1996 | 45 | 35 |
2000 | 50 | 30 |
Cross-checking against the medium establishments (red) series confirms the chart consistently tracks employment share, not unemployment -- all three series describe how the total manufacturing workforce is split among establishment sizes in a given year, never a rate of joblessness. So Statement I is supported and Statement II is not.
Only Statement I is correct.