Directions : Study the graph and answer the questions: The bar chart is given…
2025
Directions : Study the graph and answer the questions:
The bar chart is given below:
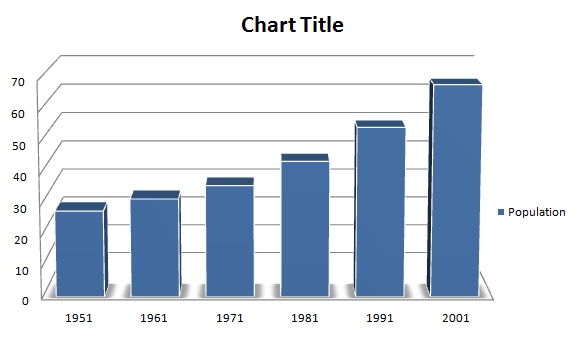
In which census year, the per cent increase in population is highest as compared to that in the previous census year?
Answer: D. 2001 — Step-by-Step SolutionTo find the year with the highest percentage increase, we calculate the growth rate for each decade using the formula: Percentage…
- A.
1971
- B.
1981
- C.
1991
- D.
2001
Attempted by 2 students.
Show answer & explanation
Correct answer: D
Step-by-Step Solution
To find the year with the highest percentage increase, we calculate the growth rate for each decade using the formula: Percentage Increase = [(Current Year Population - Previous Year Population) / Previous Year Population] * 100
Based on the graph, the approximate population values are:
1951: 28
1961: 32
1971: 36
1981: 44
1991: 54
2001: 68
Calculate Growth Rates:
1951–1961: (32-28)/28 = 14.3%
1961–1971: (36-32)/32 = 12.5%
1971–1981: (44-36)/36 = 22.2%
1981–1991: (54-44)/44 = 22.7%
1991–2001: (68-54)/54 = 25.9%
Comparing these percentages, the increase from 1991 to 2001 is the highest.