Directions for questions : The following diagram shows the percentage share of…
2024
Directions for questions : The following diagram shows the percentage share of manufacturing sector in total employment in small, medium and large establishments individually. The definitions of small, large and medium establishments are shown below in the diagram
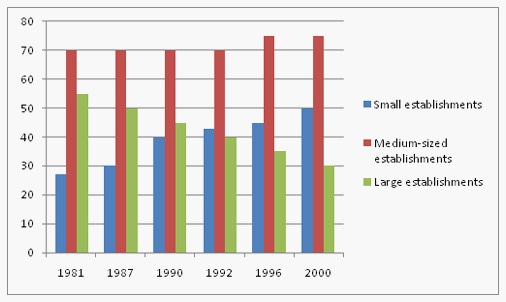
Small establishments are defined as those with fewer than 100 employees. Medium-sized establishments are defined as those with between 100 and 1500 employees. Large establishments are defined as those with more than 1500 employees. Study the diagram carefully and answer the questions given below:
In 1981 and 1987 about 50 million and 60 million people were employed in small establishments. What was the difference between the no. of employees employed in manufacturing sector small establishments in 1981 and 1987?
Answer: A. 4.5 million — Concept: When a chart shows the percentage share of a category out of a stated total for each year, first read the category's percentage for the year in…
- A.
4.5 million
- B.
4.6 million
- C.
5.6 million
- D.
6 million
Attempted by 1 students.
Show answer & explanation
Correct answer: A
Concept: When a chart shows the percentage share of a category out of a stated total for each year, first read the category's percentage for the year in question, then convert it to an absolute value using Value = (Percentage share ÷ 100) × Total for that year. To compare across two years, compute each year's absolute value separately and then subtract.
Application:
Read the small-establishments (blue) bar for 1981: it is at 27%. Total employment in 1981 = 50 million. Employees in small establishments in 1981 = 50 × 27/100 = 13.5 million.
Read the small-establishments (blue) bar for 1987: it is at 30%. Total employment in 1987 = 60 million. Employees in small establishments in 1987 = 60 × 30/100 = 18 million.
Required difference = 18 − 13.5 = 4.5 million.
Cross-check: the 1987 bar (30%) is both a higher share and applied to a larger total (60 million) than the 1981 bar (27% of 50 million), so the 1987 employee count should be well above the 1981 count — 18 million versus 13.5 million confirms this, and their difference matches 4.5 million.