Answer the questions based on the given figure below. From 2000 to 2005 in…
2023
Answer the questions based on the given figure below.
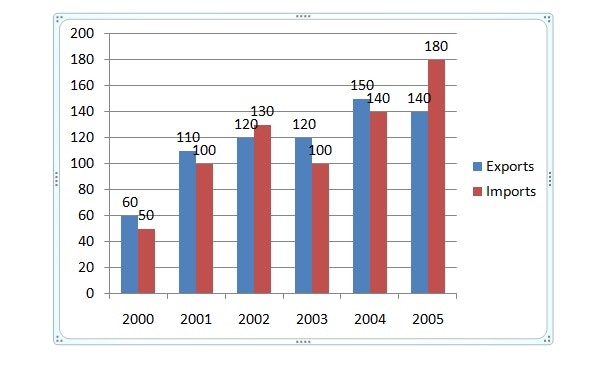
From 2000 to 2005 in which was the growth in imports as compared to the previous years was the highest?
Answer: A. 2001 — Concept: Percentage growth for a year is measured against the immediately preceding year: Growth% = ((this year's value − previous year's value) / previous…
- A.
2001
- B.
2002
- C.
2003
- D.
2004
Attempted by 1 students.
Show answer & explanation
Correct answer: A
Concept: Percentage growth for a year is measured against the immediately preceding year: Growth% = ((this year's value − previous year's value) / previous year's value) × 100. The year with the highest growth is the one where this percentage — not the raw increase in units — is the largest.
Reading the Imports (red) bars from the chart for 2000–2005: 50, 100, 130, 100, 140, 180. Applying the formula year by year:
2001 over 2000: ((100 − 50) / 50) × 100 = 100%
2002 over 2001: ((130 − 100) / 100) × 100 = 30%
2003 over 2002: ((100 − 130) / 130) × 100 ≈ −23.08% (a decline, not growth)
2004 over 2003: ((140 − 100) / 100) × 100 = 40%
2005 over 2004: ((180 − 140) / 140) × 100 ≈ 28.57%
Cross-check: comparing all five results — 100%, 30%, a decline, 40%, and 28.57% — the 2001 figure is by far the largest, more than double the next-highest year.
So the growth in imports compared to the previous year was highest in 2001.