Answer the questions based on the given figure below. For all the years…
2025
Answer the questions based on the given figure below.
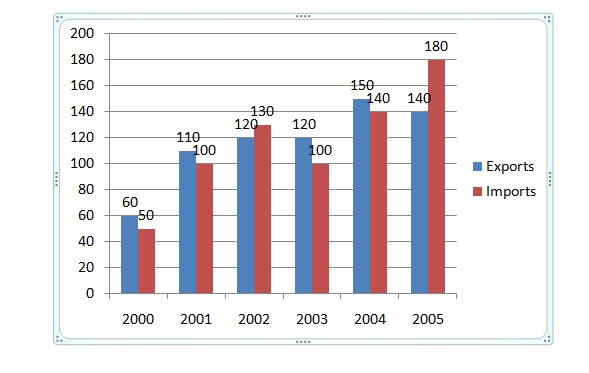
For all the years mentioned what is the average of the exports?
Answer: A. 110 — The average of a set of values equals their total sum divided by how many values there are. When the data comes from a bar chart, each labeled bar height is…
- A.
110
- B.
129
- C.
125
- D.
456
Attempted by 1 students.
Show answer & explanation
Correct answer: A
The average of a set of values equals their total sum divided by how many values there are. When the data comes from a bar chart, each labeled bar height is one data point — read every bar carefully before summing, and since chart-based average questions often round the exact computed value, pick the offered option closest to your computed average when none matches exactly.
Read the export values for all six years from the chart: 2000 = 60, 2001 = 110, 2002 = 120, 2003 = 120, 2004 = 150, 2005 = 140.
Add them in order: 60 + 110 = 170; 170 + 120 = 290; 290 + 120 = 410; 410 + 150 = 560; 560 + 140 = 700.
Divide the total by the number of years: 700 / 6 ≈ 116.7.
Comparing 116.7 with each offered value — 110, 129, 125, and 456 — the smallest gap is to 110 (about 6.7 away), closer than 125 (about 8.3 away) or 129 (about 12.3 away), confirming 110 as the best-supported choice.
So the average of the exports is closest to 110.