Directions: Answer the questions given below using the graph below: Which of…
2023
Directions: Answer the questions given below using the graph below:
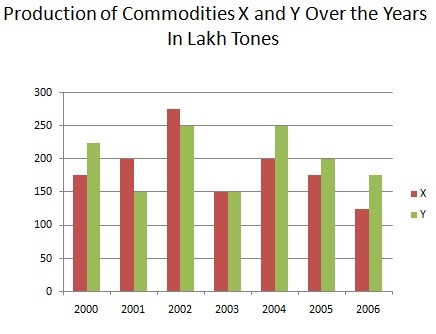
Which of the following is the average production per year (in lakh tons) of commodity Y?
Answer: D. 200 — Concept: The average of a set of values is the sum of all the values divided by how many values there are — Average = (Sum of values) ÷ (Number of values).…
- A.
234
- B.
780
- C.
657
- D.
200
Attempted by 1 students.
Show answer & explanation
Correct answer: D
Concept: The average of a set of values is the sum of all the values divided by how many values there are — Average = (Sum of values) ÷ (Number of values). When data is shown as a bar graph, each bar's height read against the y-axis is one value in that set.
Application:
Read the height of the green (commodity Y) bar for each year from 2000 to 2006: 225, 150, 250, 150, 250, 200, and 175 lakh tons.
Add the seven values: 225 + 150 + 250 + 150 + 250 + 200 + 175 = 1400 lakh tons.
Divide the total by the number of years, 7: 1400 ÷ 7 = 200 lakh tons.
Cross-check: 200 lakh tons lies between the smallest (150) and largest (250) yearly value of commodity Y, as an average must. Multiplying back, 200 × 7 = 1400, matching the summed total, so the value is confirmed.