Directions: Answer the questions given below using the graph below: Percentage…
2024
Directions: Answer the questions given below using the graph below:
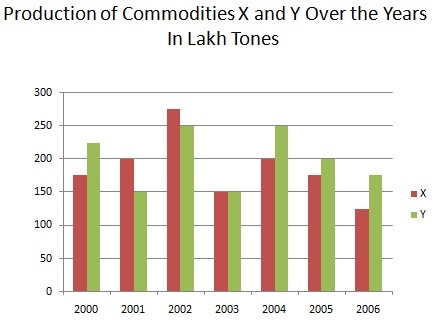
Percentage increase/ decrease in production of commodity x, during which year, was maximum from the previous year?
Answer: C. 2003 — Percentage change from one year to the next is (current year's value - previous year's value) divided by the previous year's value, times 100 -- always taken…
- A.
2004
- B.
2002
- C.
2003
- D.
2006
Attempted by 1 students.
Show answer & explanation
Correct answer: C
Percentage change from one year to the next is (current year's value - previous year's value) divided by the previous year's value, times 100 -- always taken relative to the PREVIOUS year's own value as the base, not any other year, and not the visually largest jump in the bar chart. To find which year had the maximum percentage change, this ratio must be computed for every year-over-year pair and the magnitudes compared, since a small base can turn even a modest absolute difference into a large percentage.
Year | Production of X (lakh tonnes) | Change from previous year | % Change |
|---|---|---|---|
2000 | 175 | -- | -- |
2001 | 200 | +25 | 14.29% increase |
2002 | 275 | +75 | 37.5% increase |
2003 | 150 | -125 | 45.45% decrease |
2004 | 200 | +50 | 33.33% increase |
2005 | 175 | -25 | 12.5% decrease |
2006 | 125 | -50 | 28.57% decrease |
Comparing the magnitudes of all six percentage changes -- 14.29%, 37.5%, 45.45%, 33.33%, 12.5%, 28.57% -- the largest is 45.45%, occurring in the year whose production fell from 275 to 150 lakh tonnes. Re-checking: 125 divided by 275, times 100, is approximately 45.45%, confirming it is the biggest swing (increase or decrease) in the series.
So 2003 records the maximum percentage change (a decrease of about 45.45%) in commodity X's production.