UGC NET Paper 1 Data Interpretation: Timed Methods for Tables and Charts
Learn a seven-minute practice routine for DI sets. Work through percentages, ratios, tables, line charts and pie charts without losing track of the base or unit.
KnowledgeGate Team
Exam prep & CS education
Updated 22 Aug 20266 min read
You may understand percentages and still lose a whole Data Interpretation set by reading every cell, finding totals no question needs, or choosing the wrong denominator under pressure. The solution is a repeatable scan, solve and check routine for tables, bar charts, line charts and pie charts. The seven-minute cap used below is an internal practice cap for a four-question set, not an official UGC-NET duration or question-count claim.
Scan the set in 45 seconds before calculating
Follow one fixed scan order: read the title and unit, inspect the axes or column headings, find the legend, read all four question stems, then circle the denominator and comparison word in each stem. Do not total rows or convert values before a question asks.
Split the internal seven-minute cap like this:
0:00-0:45: scan the set.0:45-5:45: solve the four questions.5:45-7:00: verify answers.
Within the five-minute solve block, solve direct reads first, then one-step ratios or percentages, leaving multi-step work until last. If no equation is written within 20 seconds, mark the item and move on. One stubborn calculation must not consume the set.
Data Interpretation is common Paper 1 work, while subject preparation has a different purpose. The UGC NET Paper 1 vs Paper 2 explainer keeps that distinction clear.
Reduce every DI calculation to percentage, ratio or difference
Write three dependable lines on your scratch pad:
Percentage:
part / whole × 100Percentage change: find
new - old, then divide byoldand multiply by100Ratio: write
a:b, then divide both terms by the greatest useful common factor
For 312/480 × 100 = 65%, the same figures give 312:480; dividing both by 24 gives 13:20. The denominator comes from the wording, not from whichever total is easiest to see.
Recall this fraction board: 1/8 = 12.5%, 1/6 ≈ 16.67%, 1/5 = 20%, 1/4 = 25%, and 1/3 ≈ 33.33%. Use it only after identifying the exact numerator and denominator.
Now consider 398/1605 × 100. Rounding it to 400/1600 × 100 = 25% is safe if the options are 22%, 25%, 28%, and 31%. The exact result is about 24.80%. The shortcut is unsafe if the options include both 24.8% and 25.0%. Inspect the option gap, estimate, then calculate exactly if needed.
Solve a table and grouped bar set without reading twice
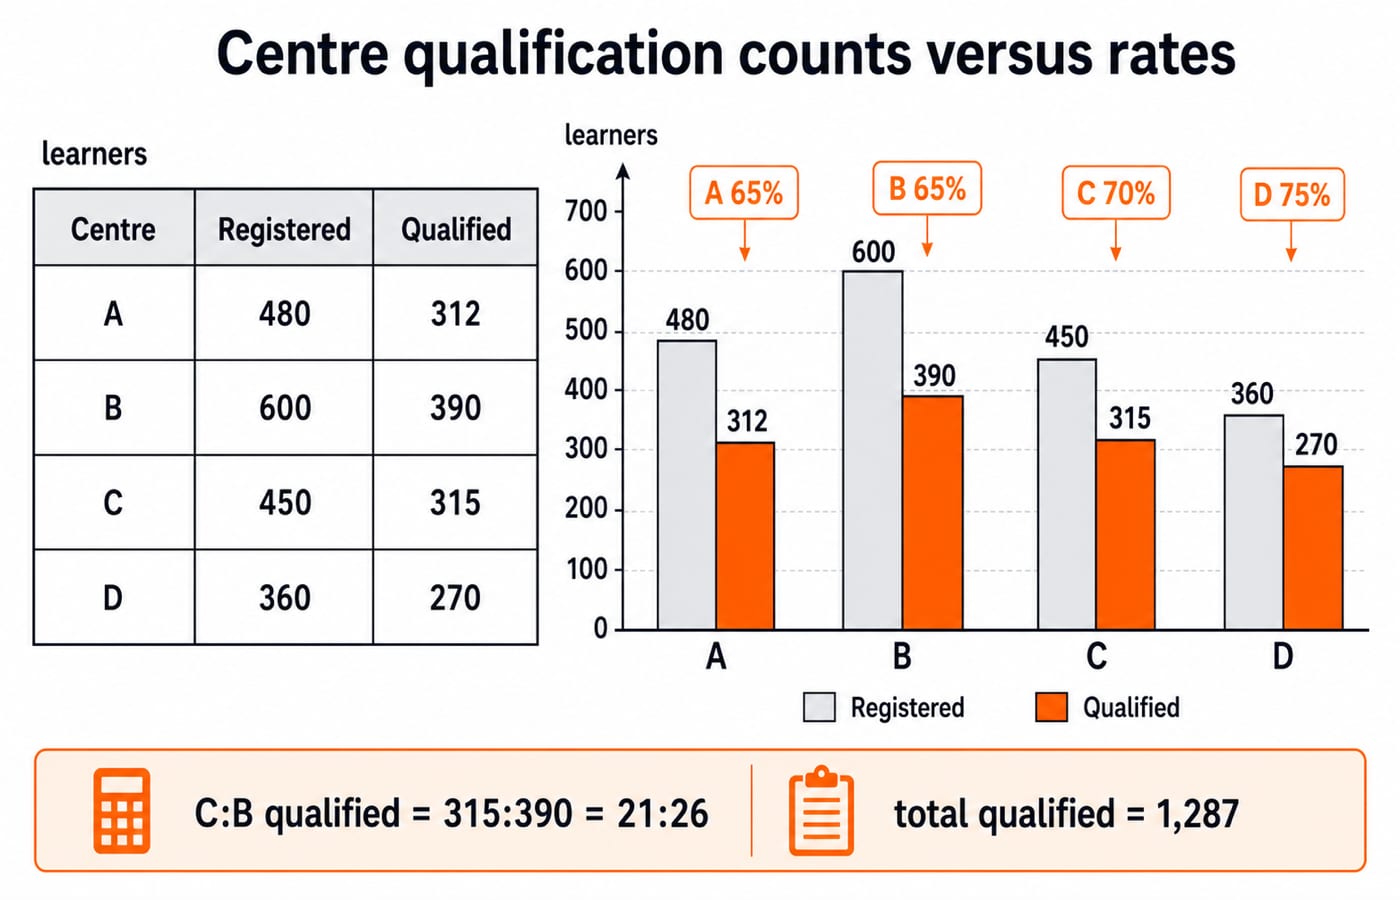
Use this invented practice dataset. Every value represents learners.
Centre | Registered learners | Qualified learners |
|---|---|---|
A | 480 | 312 |
B | 600 | 390 |
C | 450 | 315 |
D | 360 | 270 |
If data appears as grouped bars, copy only the bars named in the stem. Read the legend once: registered and qualified. The tallest bar identifies a count, not necessarily the best rate. Label the question count, rate, ratio, or share. That label shows whether two bars are enough or a column total is required. Keep units beside the figures.
First compare qualification rates, not qualified counts.
Centre | Calculation | Qualification rate |
|---|---|---|
A |
| 65% |
B |
| 65% |
C |
| 70% |
D |
| 75% |
Centre D has the highest rate even though it has the smallest qualified count. This count-versus-rate distinction is where a quick visual comparison often fails.
For a second question, qualified learners at C to B are 315:390. Divide both terms by 15 to get 21:26.
Only total the qualified column when a question needs it: 312 + 390 + 315 + 270 = 1,287. Centre C's share of all qualified learners is 315/1,287 × 100 ≈ 24.48%. Keep that separate from 315/450 = 70%, which is C's within-centre qualification rate.
Read a line chart through changes, not just heights
Plot an invented series called “proposals cleared”: April 120, May 150, June 135, July 180, and August 210. Read endpoints first, then dips or peaks, then the exact pair named in the stem.
The only fall is May to June, by 150 - 135 = 15. The largest absolute rise is June to July, by 180 - 135 = 45. Percentage change must use the earlier month as its base. Write that earlier value under the denominator:
April to May:
(150 - 120)/120 × 100 = 25%May to June:
(135 - 150)/150 × 100 = -10%June to July:
45/135 × 100 ≈ 33.33%April to August:
(210 - 120)/120 × 100 = 75%
Do not add successive percentage changes because their bases differ. For the five-month average, complete the total before dividing: (120 + 150 + 135 + 180 + 210)/5 = 795/5 = 159.
Turn a pie chart into values before comparing slices
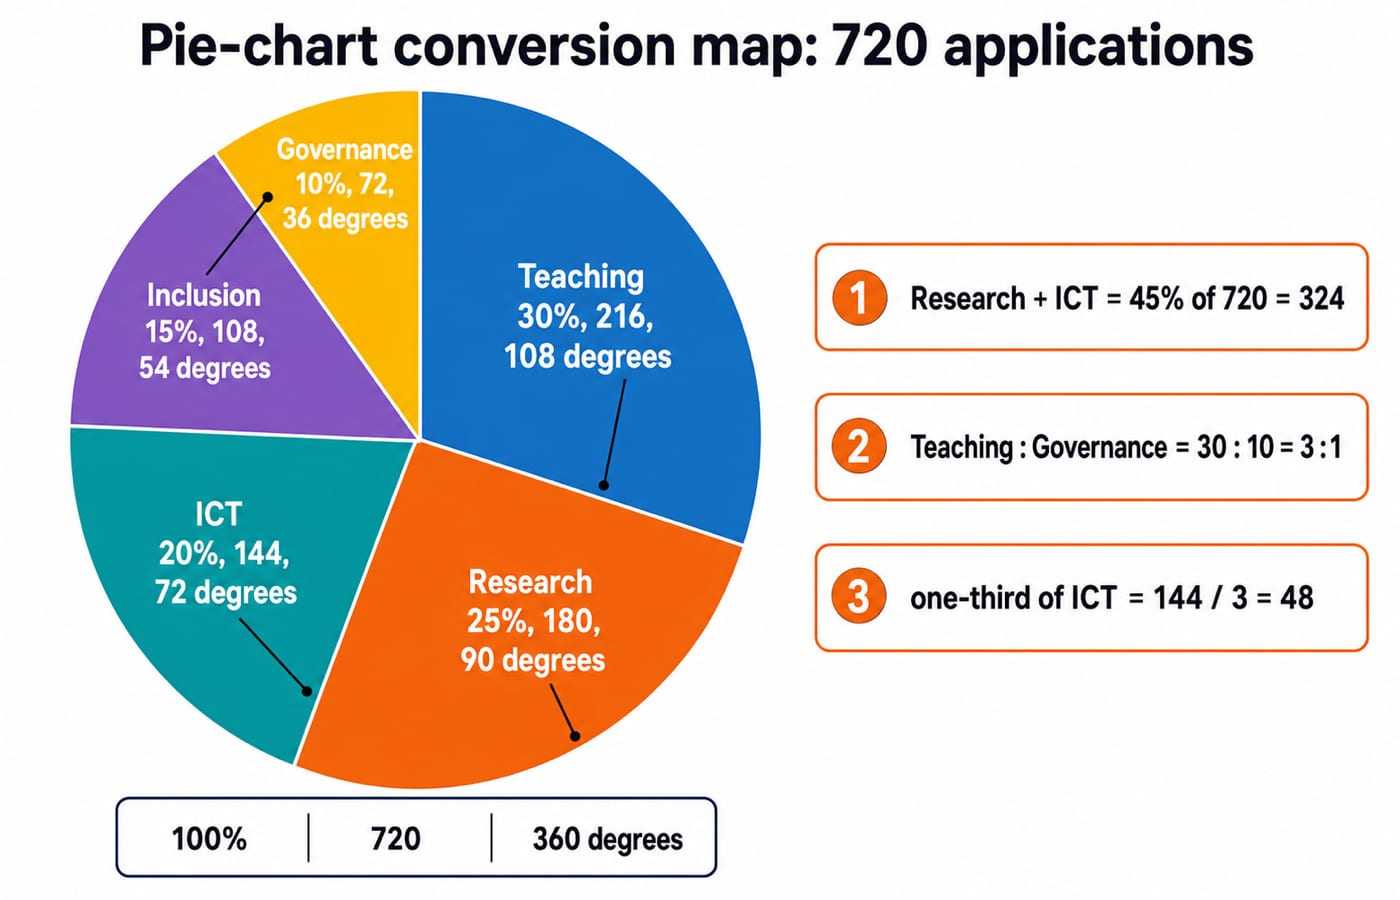
Take an invented total of 720 applications. Convert each slice into a count and an angle before comparing values.
Slice | Percentage | Count | Angle |
|---|---|---|---|
Teaching | 30% |
|
|
Research | 25% |
|
|
ICT | 20% |
|
|
Inclusion | 15% |
|
|
Governance | 10% |
|
|
Research plus ICT is 25% + 20% = 45%, so 0.45 × 720 = 324. Teaching to Governance is 30:10 = 3:1, with no need to calculate counts. One-third of ICT applications is 144/3 = 48.
Match the route to the question: use percentages for a combined share, slice percentages for a ratio, and actual values only when a count is requested.
Catch five traps in the final 75 seconds
Use the check block for five named tests:
Base test: A rate moving from
60%to72%rises by12percentage points, but its relative rise is(12/60) × 100 = 20%.Denominator test: In the centre example,
315/450answers C's rate.315/1,287answers C's share of all qualified learners.Unit test: A bar labelled
48under the unit “hundreds” represents4,800, not48.Angle test:
90°in a pie chart is90/360 = 25%, not90%.Rounding test: Retain enough precision until you select the option.
24.7975%may be reported as24.80%, but it is not exactly25%when options are close.
Make a 20-second estimate before exact arithmetic. Then ask whether the result is reasonable: percentages should stay within sensible bounds, pie slices should total 100%, and a subset cannot exceed its stated total.
Practise the official scope with a repeatable time ladder
The UGC Paper I syllabus inventory lists Data Interpretation in Unit VII: data sources; acquisition and classification; quantitative and qualitative data; graphical representation with bar charts, histograms, pie charts, table charts and line charts; mapping; data interpretation; and data and governance. It does not say every form appears in every paper.
Practise three equivalent four-question rounds:
Round 1: untimed, with every denominator written.
Round 2:
8:00, split into1:00scan,5:45solve, and1:15check.Round 3:
7:00, split into0:45scan,5:00solve, and1:15check.
Advance after correct arithmetic and denominator choices twice. Check the official UGC-NET website for current notices. Use the UGC NET CS exam preparation category for broader preparation and the UGC NET mock-test strategy to analyse and repair timed sets.
The short version: scan, normalise, solve, verify
Remember four steps: scan units and stems, normalise counts into comparable rates, solve only the requested calculation, then verify the base and unit. Approximation saves time only when the option gap protects accuracy. Repeat the routine until it feels automatic. Use the NTA UGC NET Paper 1 course for guided concept coverage and the UGC NET Paper 1 Test Series for structured timed practice.
Keep learning

Scope and Importance of International Business: UGC NET Commerce Examples
Exports, licensing and foreign investment cross borders in different ways. Separate their roles, compare entry modes and work through the opportunity-cost arithmetic behind comparative advantage.
Updated 13 Oct 20266 min readNET Strategy & Updates

FEMA Explained: Objectives, Key Provisions and UGC NET Commerce Examples
Two equal overseas payments can fall into different FEMA categories. Learn to classify transactions, apply an exporter checklist and calculate a penalty ceiling without counting the first day twice.
Updated 9 Oct 20265 min readNET Strategy & Updates

CSIR NET Normalization: Percentile and Normalised Marks Worked Out
Can 120 and 130 raw marks mean the same percentile? Follow a two-shift example from raw marks to percentile and normalised marks, then check which number belongs beside a cutoff.
Updated 5 Oct 20265 min readNET Strategy & Updates

UGC NET Eligibility for CA Holders: Equivalence, Marks and Subject Choice
Completed CA but have no MCom certificate? Understand the equivalence route, check the percentage requirement and resolve marks or subject-entry doubts before applying for NET.
30 Sep 20264 min readNET Strategy & Updates