CSIR NET Normalization: Percentile and Normalised Marks Worked Out
Can 120 and 130 raw marks mean the same percentile? Follow a two-shift example from raw marks to percentile and normalised marks, then check which number belongs beside a cutoff.
KnowledgeGate Team
Exam prep & CS education
Updated 5 Oct 20265 min read

Two aspirants compare 120 and 130 raw marks after different shifts: who has performed better relative to their session? A marks percentage tells you the share of maximum marks earned, while a percentile tells you where a score stands within its shift. We will calculate both, then work through the extra conversion to normalised marks, but first check which scoring procedure your cycle's notice specifies.
What CSIR NET normalization is comparing
Raw marks are the score obtained under the paper's marking rules. Percentage is raw marks divided by maximum marks, multiplied by 100. Percentile score measures the share of the session scoring at or below you. Normalised marks put matched performance onto a comparable marks scale.
Assume a maximum of 200: 120/200 × 100 = 60% marks. That tells us nothing about percentile without the session's score distribution.
The June 2025 Information Bulletin describes a multi-session procedure. Different distributions motivate matching, but do not establish which paper was objectively harder. A single-session paper needs no cross-shift matching.
Scope note: Every example score, cohort size and threshold here is invented, hypothetical teaching data, not historical results or a score predictor. The procedure described comes from the June 2025 bulletin; confirm your own cycle's notice.
The percentile formula, including the candidate and ties
Annexure XIV of the NTA CSIR NET June 2025 Information Bulletin gives the within-session calculation:
P = 100 × C / N
Here, N is the number who appeared in the same subject's session, and C counts candidates with total raw scores less than or equal to yours. Absentees and candidates from another shift do not enter N; registration totals are not attendance totals.
Take five scores: [20, 40, 40, 60, 80]. For either candidate scoring 40, include the score of 20 and both scores of 40:
C = 3; P = 100 × 3/5 = 60.0000000.
Counting only lower scores wrongly gives 100 × 1/5 = 20.0000000.
The topper gets 100 × 5/5 = 100.0000000.
The lowest scorer gets 100 × 1/5 = 20.0000000, not zero.
The cited procedure specifies seven decimal places. Keep calculations exact until presentation; equal raw scores within one session still share a percentile.
A complete two-shift example: 120 and 130 can both mean the 90th percentile
Use these complete distributions, arranged in ascending order. Each entry represents one appeared candidate, so you can check every count yourself.
Shift A, 10 candidates: [40, 50, 60, 70, 80, 90, 100, 110, 120, 150].
Shift B, 20 candidates: [20, 30, 40, 50, 60, 70, 80, 85, 90, 95, 100, 105, 110, 115, 120, 125, 128, 130, 140, 160].
The unequal cohort sizes make the denominator important. Do not pool them into a single group of 30.
Candidate | Shift | Raw marks | At or below, C | Appeared, N | Percentile score |
|---|---|---|---|---|---|
Asha | A | 120 | 9 | 10 | 90.0000000 |
Bharat | B | 130 | 18 | 20 | 90.0000000 |
Charu | B | 120 | 15 | 20 | 75.0000000 |
For Asha, 9/10 = 0.9, so 100 × 0.9 = 90.0000000. For Bharat, 18/20 = 0.9, again giving 90.0000000. For Charu, 15/20 = 0.75, giving 75.0000000.
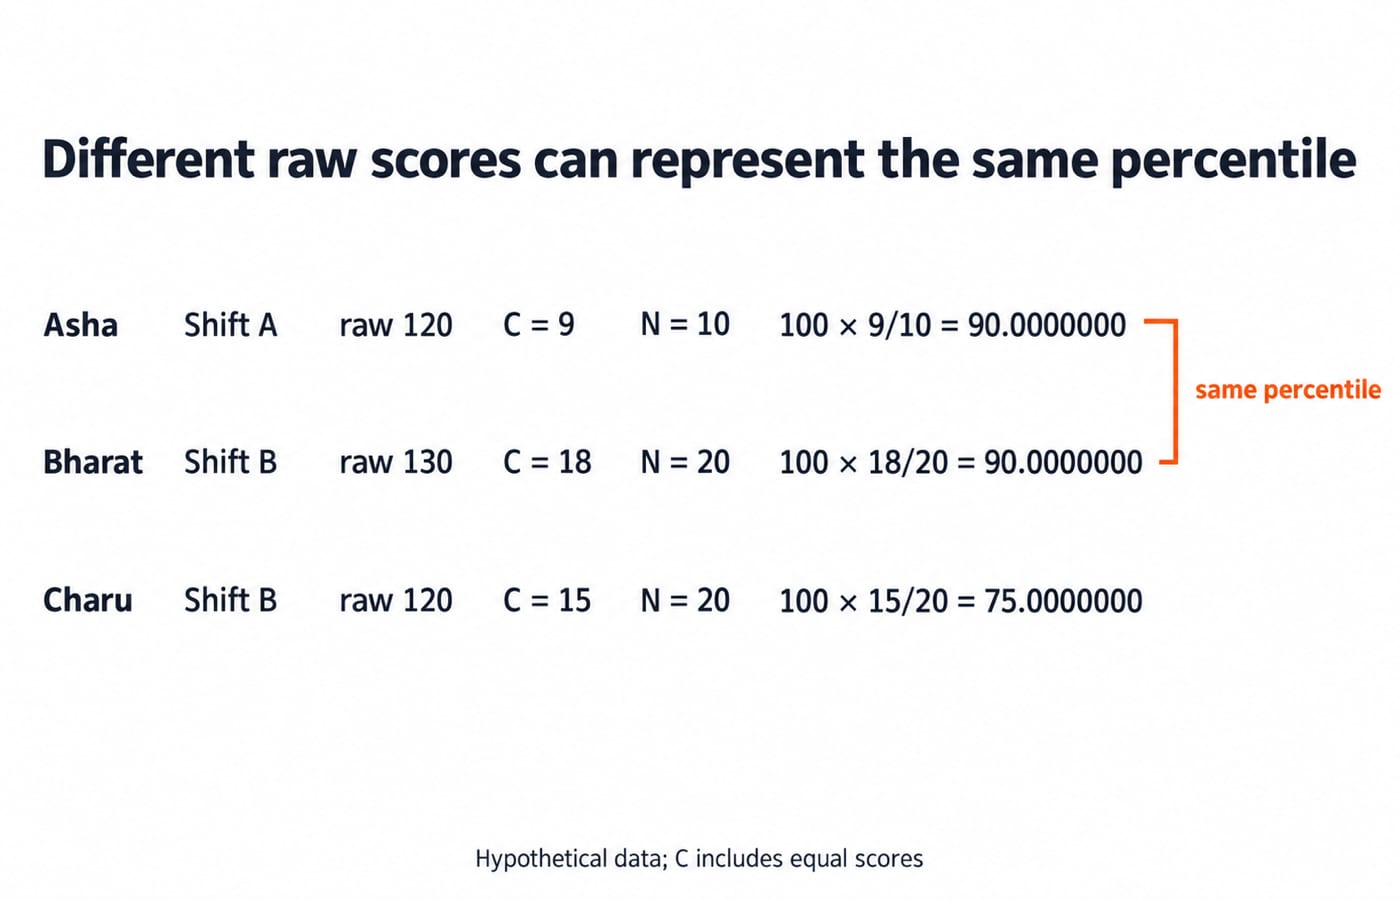
With our assumed 200-mark maximum, Asha has 120/200 × 100 = 60% marks; Bharat has 130/200 × 100 = 65%. Their percentages differ, yet their percentiles match. Asha and Charu have equal raw marks but different percentiles. None of these within-shift figures directly supplies an all-India rank.
From percentile to normalised marks: matching, then interpolation
The same bulletin's Annexure XV adds the conversion to normalised marks: match each percentile across sessions, interpolate missing equivalents, then average the corresponding scores.
At percentile 90, our dataset supplies raw 120 in Shift A and raw 130 in Shift B:
Normalised marks = (120 + 130)/2 = 250/2 = 125.
That is neither 90 marks nor a universal five-mark bonus. Asha's raw score is below 125; Bharat's is above it.
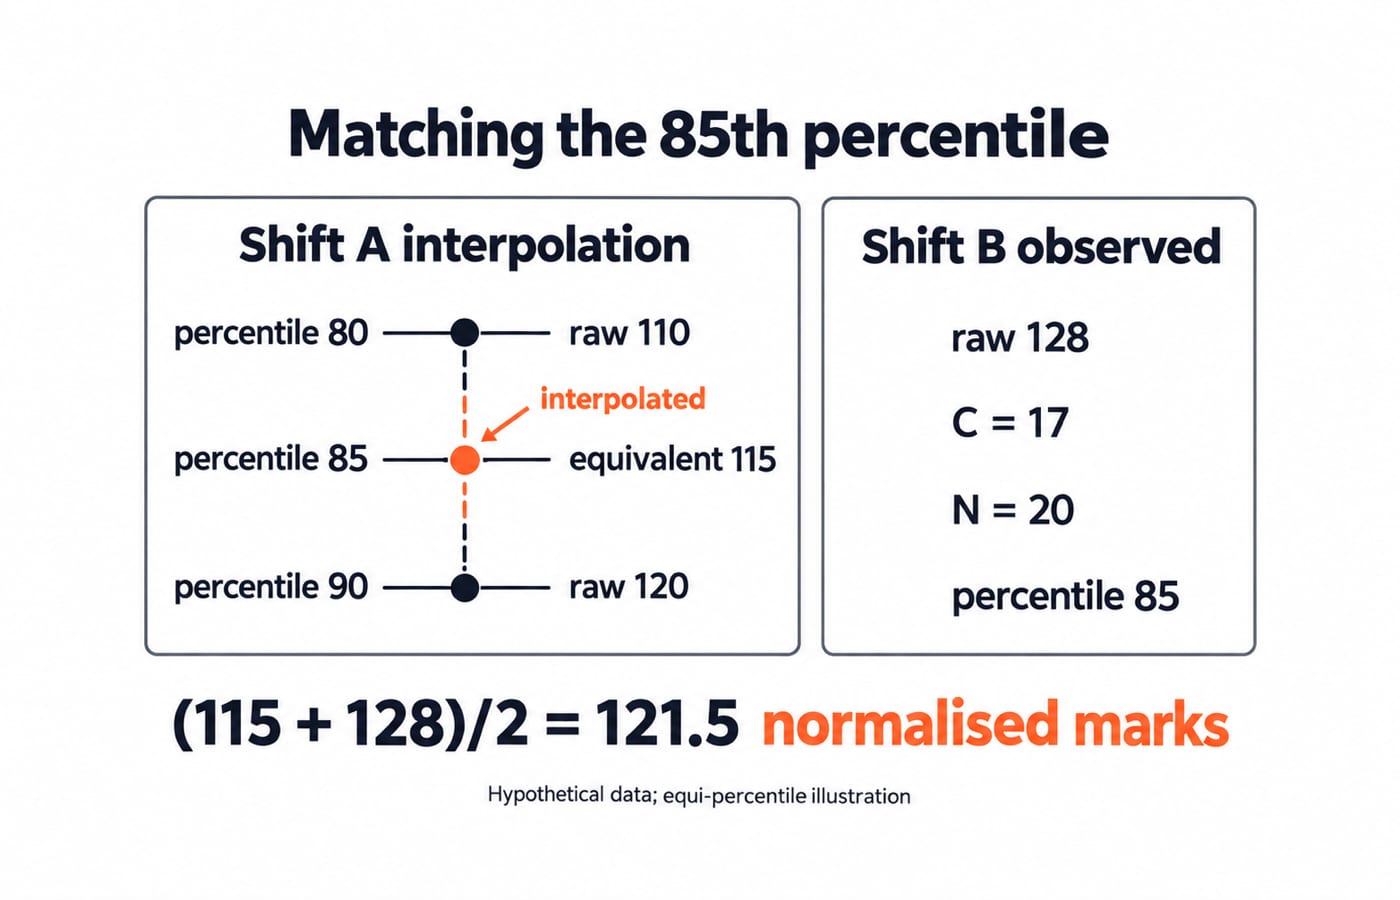
Now take the Shift B candidate scoring 128. There are 17 scores at or below 128, so P = 100 × 17/20 = 85. Shift A has no candidate at percentile 85. Its neighbouring points are raw 110 at percentile 80 and raw 120 at percentile 90.
Find the missing equivalent by linear interpolation:
110 + ((85 − 80)/(90 − 80)) × (120 − 110)
= 110 + (5/10) × 10 = 110 + 5 = 115.
Percentile 85 lies halfway between 80 and 90, so its equivalent lies halfway between 110 and 120. The 115 is an interpolated equivalent, not an observed candidate's mark.
Average the matched values: (115 + 128)/2 = 243/2 = 121.5 normalised marks.
Cutoff comparisons: match the metric before comparing the number
Our Shift B candidate now has three labels: 128 raw marks, percentile 85, and 121.5 normalised marks. Against a threshold of 121 normalised marks, the numerical margin is 121.5 − 121 = 0.5 marks. Comparing percentile 85 with that threshold mixes two different scales.
This checks units, not qualification. Before comparing a score with a cutoff, match the cycle, subject, category, award or eligibility outcome, and score metric named in the result notice. A minimum requirement and a final selection threshold need not be the same.
Past marks cannot be converted into a new cycle's percentile without the relevant distributions. A familiar-looking number is not enough.
For comparison, UGC NET CS Cutoff: Qualifying Marks vs Final Cutoff concerns a separate exam and supplies no CSIR NET thresholds, but reinforces the habit of checking what a cutoff measures.
How to use this for the exam without chasing a predicted bonus
Try a self-check: what percentile does raw 125 receive in Shift B? Count before reading on.
It has C = 16 out of N = 20: 100 × 16/20 = 80.0000000. Shift A's raw 110 also corresponds to percentile 80, so normalised marks are (110 + 125)/2 = 117.5. The matched scale rises 117.5 → 121.5 → 125 as percentile rises 80 → 85 → 90.
Use this for result literacy:
Replace assumptions about a harder-shift bonus with the notified calculation.
Count within the correct session; pooling shifts changes the denominator.
Treat coaching polls as incomplete, self-selected samples, not the official distribution.
Read your applicable bulletin and result notice on the NTA CSIR NET official portal.
If you are also preparing for UGC NET, browse the UGC NET preparation category.
The short version and your next step
Asha's 120 raw marks become percentile 90 in Shift A. The matching Shift B score is 130, and their equivalent normalised marks are 125 under the illustrated method. Raw marks, marks percentage, percentile score and normalised marks answer distinct questions.
Next, identify your scorecard's metric, open the applicable cycle's scoring notice, and compare only with the matching cutoff metric.
If you are also preparing for UGC NET, the NTA UGC NET Paper 1 course is a separate preparation option.
Keep learning

UGC NET Eligibility for CA Holders: Equivalence, Marks and Subject Choice
Completed CA but have no MCom certificate? Understand the equivalence route, check the percentage requirement and resolve marks or subject-entry doubts before applying for NET.
30 Sep 20264 min readNET Strategy & Updates

UGC NET CS Attempt Strategy Without Negative Marking: A Three-Pass Plan
Use a rehearsed 180-minute clock to answer quick recalls first, protect time for technical work, and leave disciplined elimination and guesses until the final pass.
Updated 4 Sep 20265 min readNET Strategy & Updates

UGC NET Paper 1 Higher Education Timeline: Institutions, Commissions, Policies and Digital Initiatives
Turn disconnected Higher Education dates into a classified timeline. Learn the ancient centres, modern bodies, policies and digital initiatives through worked ordering drills.
Updated 3 Sep 20266 min readNET Strategy & Updates

UGC NET CS and GATE CS Study Plan: A 16-Week Integrated Schedule
Prepare the shared CS core once, then protect separate lanes for Paper 1, NET-only topics and GATE problem solving. This plan shows exactly how to allocate, review and recover 18 study hours each week.
Updated 1 Sep 20265 min readNET Strategy & Updates