Research Process Steps for Teaching Exams: Complete Notes with a Worked Classroom Study
Learn the complete research process through a connected classroom example. Follow the problem, design, data, calculations, interpretation and report in order.
KnowledgeGate Team
Exam prep & CS education
Updated 10 Aug 20266 min read

You may define hypothesis, sample and research design, yet lose the correct order or fail to connect one stage to the next. The order is dependency-based: every stage consumes what the previous one produced, so a stage out of place quietly invalidates everything after it. Textbooks may split or combine stages, but the logic remains stable: define the problem before collecting data, decide the design before analysis, and interpret only after results exist.
1. Research process steps: the complete sequence and what each stage produces
Research is a systematic, logical, evidence-based enquiry into a bounded problem. The research process is the full sequence, research design is the answer plan, and research methods are tools such as tests, questionnaires, interviews and observations.
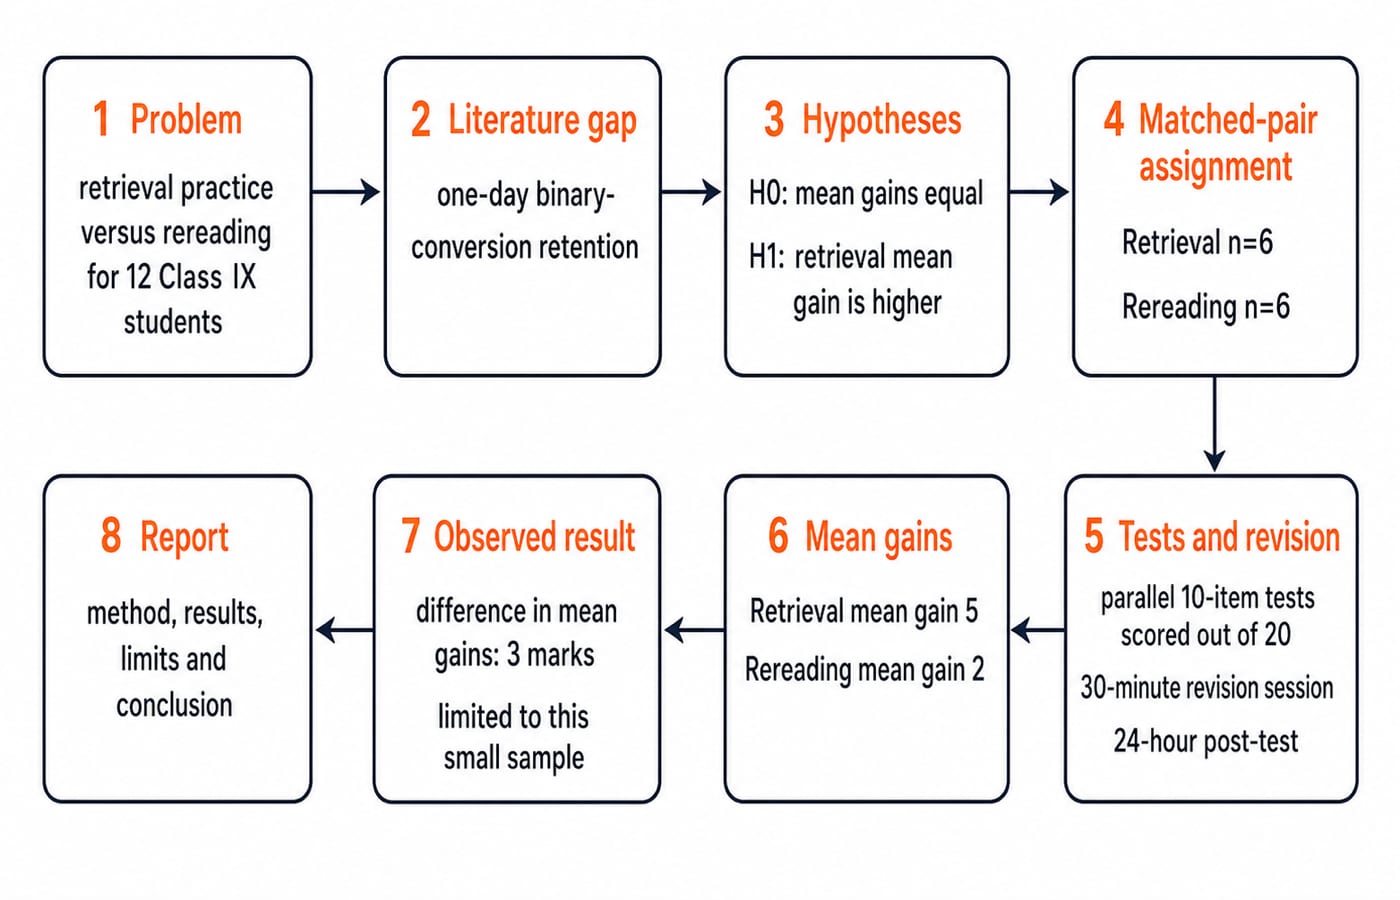
The chain is:
Identify and delimit the problem: problem statement.
Review literature: gap and conceptual basis.
Set objectives or questions and formulate hypotheses: testable claims.
Choose design and sample: study plan.
Select tools and collect data: observations.
Organise and analyse: results.
Interpret, conclude and generalise cautiously: meaning.
Write and report: auditable record.
Sources may separate sampling or hypothesis testing without changing the order. UGC NET Paper 1 vs Paper 2: What Each Tests locates research aptitude in that distinction; UGC NET CS Exam Preparation is the wider route.
2. Research problem, variables and objectives: turn a broad idea into a testable question
Does revision help? is too broad. In this invented teaching example, ask: Among 12 Class IX students in one school, does a 30-minute retrieval-practice session produce a larger gain on a 20-mark binary-number-conversion test after 24 hours than 30 minutes of rereading the same notes?
The independent variable is revision method, retrieval practice or rereading. The dependent variable is gain: post-test score - pre-test score. Controls are the teacher, topic, notes, room, 30-minute duration and 24-hour interval; sleep, prior practice and motivation are possible extraneous variables. The population is the relevant Class IX students, while the accessible sample is 12 learners from one section.
The objective is to compare the two groups' mean gain scores, not to name a method or expected result. Computer Science Pedagogy for Teacher Exams sets out the wider classroom decisions that surround a comparison like this one.
3. Literature review and hypotheses: move from what is known to what will be tested
A literature review is critical synthesis, not a summary list. Use this extraction grid: source and year | participants | intervention or variable | measure | main finding | limitation or gap. The gap that grid exposes for this question is one-day retention of binary conversion in a single Class IX setting.
Pre-specify the hypotheses:
H0: μgain,retrieval = μgain,rereadingH1: μgain,retrieval > μgain,rereading
The null gives no difference in population mean gains; the directional alternative predicts a higher retrieval mean. A hypothesis must be clear, specific, testable and operationally defined. A question asks what is investigated, an objective what the study does, and a hypothesis states an expectation. Writing H1 after seeing scores reverses the process.
4. Research design and sampling: separate selection from assignment
Convenience-sample 12 students from one Class IX section. Pair equal pre-test scorers, then toss a coin within each pair to assign one to Retrieval and one to Rereading, giving n=6 each. Retrieval completes three cycles of 5 minutes closed-book recall + 5 minutes feedback = 30 minutes; Rereading studies the same notes for 30 minutes.
Random sampling from a population supports representativeness; random assignment to conditions supports fair comparison. Here only assignment is random, so convenience selection limits generalisation. Experimental designs manipulate, descriptive designs describe, correlational designs examine association, and case studies investigate one bounded case deeply. Association alone does not prove causation.
Proportional stratified sampling allocates places in proportion to stratum size. Suppose 240 trainee teachers include 144 science-stream and 96 humanities-stream members. A proportional stratified sample of 60 selects:
Science:
60 × 144/240 = 36Humanities:
60 × 96/240 = 24Check:
36 + 24 = 60
Convenience sampling has no proportional allocation.
5. Data collection tools, measurement quality and ethics
A test measures performance, a questionnaire records self-reports, an interview permits probing, and observation records behaviour. Parallel pre-test Form A and post-test Form B each have 10 items × 2 marks = 20 marks from one blueprint. Equivalence still requires blueprint review and piloting.
Validity concerns the intended interpretation; reliability concerns consistency. Revision group, retrieval or rereading, is nominal, satisfaction low/medium/high ordinal, Celsius temperature interval, and revision time in minutes ratio. Scale and design guide analysis.
Obtain consent or assent as applicable, ensure voluntary participation, anonymise learners as RP1-RP6 and RR1-RR6, secure data, and do not disadvantage the comparison group. A controlled design can be unethical; ethical approval cannot make an invalid tool valid.
6. Data analysis and interpretation: gains, means and the observed difference
Each gain is post-test minus pre-test. The scores below are constructed for teaching, not collected from a real class.
Pair | Retrieval pre | Retrieval post | Retrieval gain | Rereading pre | Rereading post | Rereading gain |
|---|---|---|---|---|---|---|
1 | 8 | 12 | 4 | 8 | 10 | 2 |
2 | 9 | 14 | 5 | 9 | 11 | 2 |
3 | 10 | 15 | 5 | 10 | 11 | 1 |
4 | 10 | 16 | 6 | 10 | 12 | 2 |
5 | 11 | 16 | 5 | 11 | 14 | 3 |
6 | 12 | 17 | 5 | 12 | 14 | 2 |
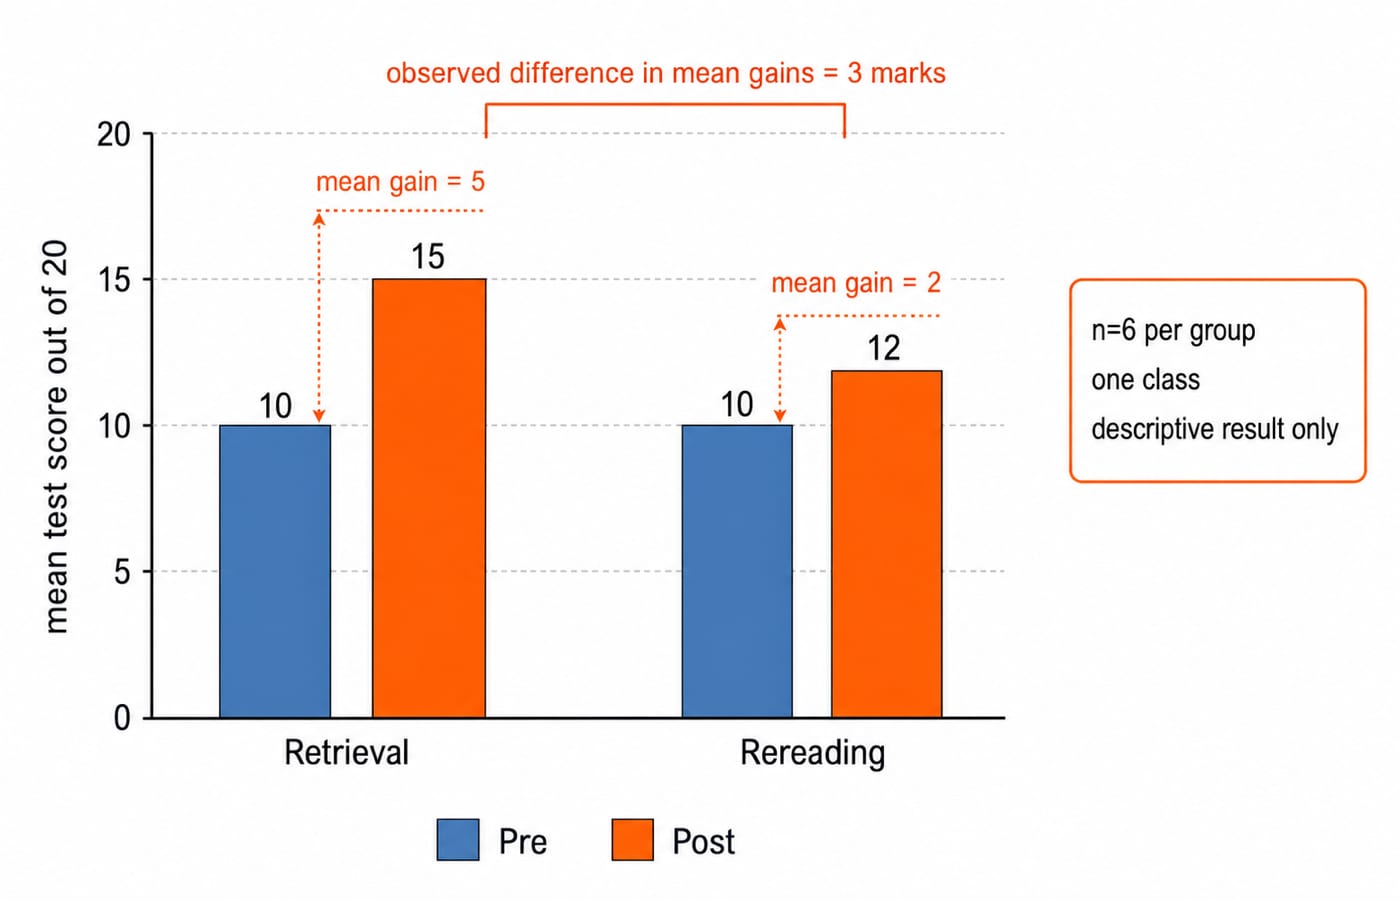
Both pre-test totals are 8 + 9 + 10 + 10 + 11 + 12 = 60; both means are 60/6 = 10.
Retrieval post total is 12 + 14 + 15 + 16 + 16 + 17 = 90, mean 90/6 = 15. Gains total 4 + 5 + 5 + 6 + 5 + 5 = 30, mean 30/6 = 5.
Rereading post total is 10 + 11 + 11 + 12 + 14 + 14 = 72, mean 72/6 = 12. Gains total 2 + 2 + 1 + 2 + 3 + 2 = 12, mean 12/6 = 2. Difference in mean gains is 5 - 2 = 3 marks on the 20-mark scale.
Retrieval has the larger observed mean gain in this illustrative sample. It is not statistically significant by assertion or generalisable to all students. Limits are one class, convenience selection, a very small sample and one 24-hour outcome. Population-level causal claims require suitable inferential analysis and satisfied assumptions.
7. Research report and teaching-exam traps: keep result, conclusion and sequence separate
Title and abstract summarise. Introduction gives the problem and reviewed basis; method records sample, assignment, tools, procedure and ethics; results show the table and calculations; discussion interprets the 3-mark difference and limits; conclusion answers the narrow question. References credit sources; appendices hold instruments. Results state what was found, discussion what it may mean.
Concept questions can test stage order; process, design and method; population and sample; sampling and assignment; variable roles; H0 and H1; tool choice; or result, interpretation and generalisation. More than 110 practice questions cover research process steps within Research Aptitude, enough to drill each of those distinctions on its own.
Trap | Why it fails | Correction |
|---|---|---|
Collect data before defining the problem | Irrelevant observations | Bound the question first |
Write H1 after seeing scores | Result-driven hypothesis | Pre-specify H0 and H1 |
Random assignment means representative sample | Assignment and selection solve different problems | Name each separately |
Larger mean proves significance | A descriptive difference is not an inferential decision | Test with suitable assumptions |
Correlation proves cause | Third variables and direction remain | Use an appropriate causal design and cautious wording |
8. Research process steps: the short version and the next study step
Recall: problem -> review -> hypothesis -> design -> collect -> analyse -> interpret -> report. Here both groups start at mean 10, Retrieval gains 5, Rereading gains 2, and the observed difference is 3 marks. The small convenience sample prevents broad generalisation.
In five minutes, reconstruct the question, label IV and DV, write H0 and H1, redo 36 + 24 = 60, and calculate means from totals 60, 90 and 72. If order or arithmetic breaks, return to that stage.
For a sequenced route, the NTA UGC NET Paper 1 Course includes Research Process Steps under Research Aptitude. If you need only this topic, rework the eight stages against your own example, then drill the practice questions on it.
Keep learning

ICT in Education MCQs: 12 Solved Questions on Digital Learning Tools
Solve 12 ICT in Education MCQs, then use clear explanations and a five-layer model to separate files, tools, platforms and public initiatives.
Updated 3 Oct 20268 min readUGC NET Computer Science

Requirements Elicitation Techniques and Use Case Development: Worked Library Example
Follow a fictional library reservation from interviews and observation through testable requirements, a UML use-case model, UC-07, and acceptance checks.
Updated 28 Sep 20266 min readUGC NET Computer Science

Quality Factors: McCall’s and ISO 9126 Models with a Worked Scoring Example
Build both quality models around one maintainability audit. This guide maps their vocabulary, calculates McCall-style and ISO-style scores, and ends with exam-focused checks.
Updated 25 Sep 20265 min readUGC NET Computer Science

Cohesion and Coupling MCQs: 10 Solved Questions on Functional Independence
Practise 10 solved MCQs on cohesion, coupling, functional independence, module dependencies, and the distinctions that make closely matched options easier to separate.
Updated 24 Sep 20267 min readUGC NET Computer Science