IISc Administrative Assistant MS Office: Word, Excel and PowerPoint Workflows
Follow one administrative task from raw figures to a Word summary, an Excel calculation sheet and a three-slide PowerPoint brief. Learn the operations and traps at each step.
KnowledgeGate Team
Exam prep & CS education
Updated 28 Jul 20266 min read

You may know how to type a letter or enter figures, yet lose the answer when the task asks for styles, an absolute reference, a whole-table sort or a chart that preserves its source values. The useful skill is moving one office task correctly across applications. So take one week of application-processing figures and carry them through Word, Excel and PowerPoint without letting a single number drift. The names, dates and values are illustrative, chosen so you can check every result yourself.
IISc Administrative Assistant MS Office preparation starts with tasks
Learn each application through the output an office needs, not through a memorised list of menus.
Office task | Best application | Core operation | Visible output |
|---|---|---|---|
Issue a weekly summary | Word | Styles, table, page break |
|
Calculate processing status | Excel | Formulas, references, sort and filter |
|
Brief a section officer | PowerPoint | Chart, hierarchy and slide layout |
|
MS Office Applications sits under Knowledge in Computer Applications on the IISc Administrative Assistant Exam Preparation route, alongside aptitude, reasoning, English and general awareness. Access, the database application, is treated separately in IISc role material, so it plays no part in this task. For extra drilling on the same operations in a different exam setting, work through MS Office for CS Teaching Exams.
Microsoft Word workflow: turn figures into an office-ready summary
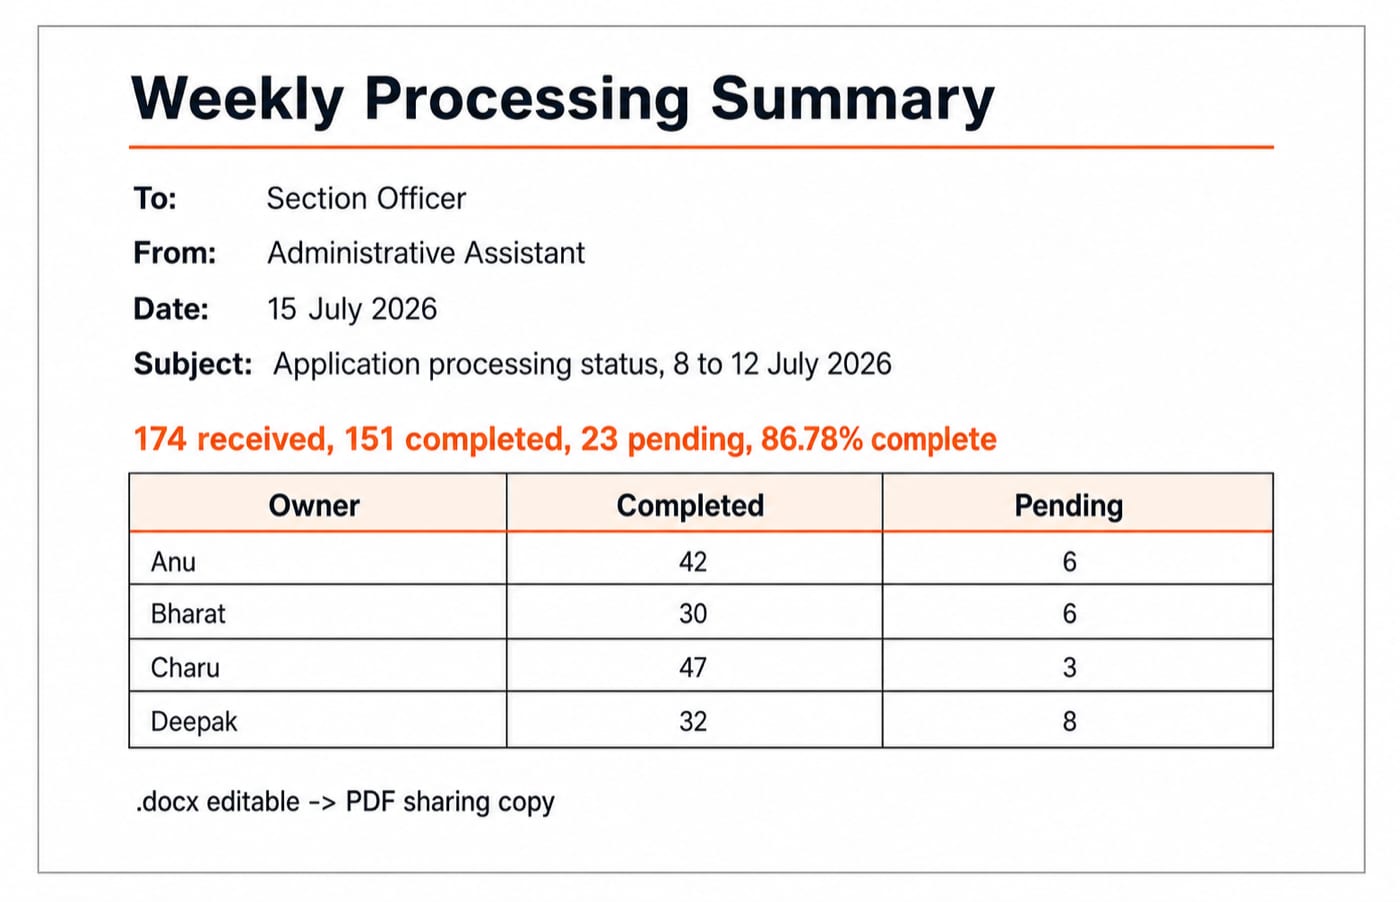
Create a one-page document titled Weekly Processing Summary. Add To: Section Officer, From: Administrative Assistant, Date: 15 July 2026, and Subject: Application processing status, 8 to 12 July 2026. Its first sentence is: The section received 174 applications, completed 151 and has 23 pending. The overall completion rate is 86.78%.
Apply the Title style to the title and keep the four metadata labels consistently bold. Insert a clear table headed Owner | Completed | Pending, with Anu 42 | 6, Bharat 30 | 6, Charu 47 | 3, and Deepak 32 | 8. The action list should prioritise Deepak's 8 pending records, Anu's and Bharat's 6 each, then Charu's 3. The check is 8 + 6 + 6 + 3 = 23.
Use a page break for a deliberate new page, not repeated Enter presses. Use tables rather than spaces for alignment, and Find and Replace for a repeated edit. Keep .docx as the editable working file; export a PDF as the fixed sharing copy.
Microsoft Excel formulas: calculate without hiding the logic
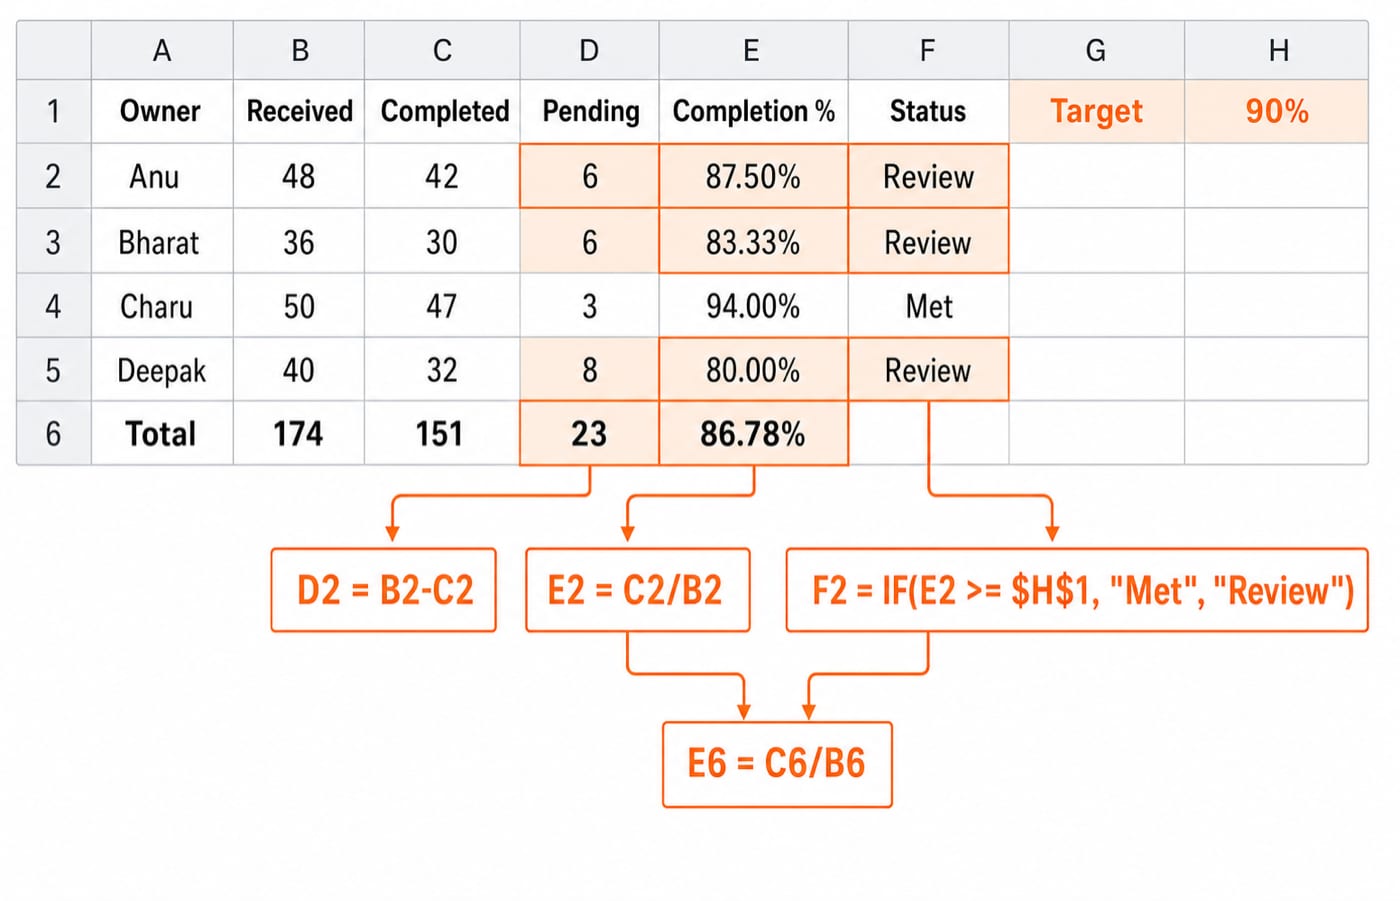
Set columns A to F as Owner, Received, Completed, Pending, Completion %, and Status. Enter Anu 48 | 42, Bharat 36 | 30, Charu 50 | 47, and Deepak 40 | 32. Put Target in G1 and 90% in H1.
In D2, enter =B2-C2. It returns 6; filling down gives 6, 6, 3, 8. In E2, enter =C2/B2, format it as a percentage, and fill down. The results are 87.50%, 83.33%, 94.00%, 80.00%. In F2, enter =IF(E2>=$H$1,"Met","Review"). Filling down gives Review, Review, Met, Review. $H$1 remains fixed, while the row references change.
This copying behaviour is the point of relative references. On the next row, B2-C2 becomes B3-C3, and C2/B2 becomes C3/B3. The target is different: every status must compare with one cell, so both its column and row need dollar signs.
In row 6, =SUM(B2:B5) gives 174, =SUM(C2:C5) gives 151, and =SUM(D2:D5) gives 23. Overall completion is =C6/B6 = 151/174 = 86.78% after formatting. This rate is weighted. =AVERAGE(E2:E5) is about 86.21% because it weights owners equally despite different received totals.
Excel sorting and filtering: preserve complete records
Sort Completion % from largest to smallest across the full table. Include the headers and expand the selection so each row moves as one record. The resulting order must be Charu 94.00%, Anu 87.50%, Bharat 83.33%, Deepak 80.00%. Sorting column E alone would detach percentages from owners and corrupt the records.
Apply the filter Pending >= 6. Only Anu 6, Bharat 6 and Deepak 8 remain visible; Charu 3 is hidden. Clearing the filter restores all four rows because filtering temporarily hides non-matches, whereas deleting removes records permanently.
Now create a clustered column chart from owner names with Completed and Pending. Its pairs are 42/6, 30/6, 47/3, and 32/8. The chart supports comparison, but the verified table remains the source of truth.
PowerPoint workflow: brief the result in three slides
Slide 1, Weekly Processing Status, shows 151 completed, 23 pending, and 86.78% complete. Slide 2, Completed and Pending by Owner, uses the Excel chart with Anu 42/6, Bharat 30/6, Charu 47/3, and Deepak 32/8. Slide 3, Immediate Action, lists Deepak: 8 pending; Anu and Bharat: 6 each; Charu: 3.
Give each slide one message. Keep title positions consistent, labels readable, colours restrained and objects aligned. Avoid animation that competes with the numbers. A slide is a briefing aid, not a Word page squeezed into a rectangle.
A linked chart can update with its workbook. An embedded copy travels inside the presentation but becomes separate. A static image fixes appearance but removes editable data. Choose according to whether automatic updates or a fixed record matters, then check the transferred numbers against Excel.
MS Office workflow traps that produce wrong answers
Manual alignment: Spaces and blank lines may look right on one screen, then break when fonts, margins or content change. Use styles, tables, tabs and page breaks instead. Change a margin or resize a column as a quick stress test; misplaced content exposes fragile manual layout.
Broken references: H1 and $H$1 look similar, but filling =IF(E2>=H1,...) down shifts the target. Lock it as $H$1 and inspect copied formulas. Also check whether the question needs an equal-weight average or total completed / total received.
Unsafe sort and presentation drift: Sorting one column breaks row relationships. Retyping chart values in PowerPoint creates competing versions. Sort the complete table and keep one verified Excel source for every number used in Word and PowerPoint.
IISc Administrative Assistant preparation: rehearse the whole workflow, not single commands
IISc role material for the post expects effective use of Office applications, so the practice that pays is operational: which command, which reference, which output. The official IISc Regular Positions page carries the Administrative Assistant recruitment material and job description, and it is where the current cycle's marks, question counts and timings are stated.
Practise choosing the structural Word command for a new page, distinguishing an editable document from a fixed sharing copy, predicting =SUM(C2:C5) as 151, explaining why $H$1 stays fixed, and identifying that Pending >= 6 leaves Anu, Bharat and Deepak visible. For a sequence question, verify Excel totals first, update the Word summary and PowerPoint chart, then export the sharing copy.
To widen the same skill beyond Office, SSC CGL Tier 2 Computer Knowledge: Topics and Strategy maps the surrounding computer-awareness ground, and SSC CGL Tier 2 Computer Knowledge Questions with Answers supplies operational practice in the same command-and-output style.
The short version: practise from source data to final brief
Use Word to structure the document, Excel to calculate and validate, and PowerPoint to present only the decision-ready result. Sort and filter without breaking records, and audit the same four values everywhere: 174 received, 151 completed, 23 pending, 86.78% complete.
If you want MS Office Applications placed inside a wider computer, aptitude, reasoning, English and awareness route, continue with the IISc Administrative Assistant 2026 Course. Keep the course for guided preparation and IISc's current recruitment material as the authority for every official cycle-specific detail.
Keep learning

IISc Administrative Assistant Arithmetic: Master Percentages, Ratios and Data Interpretation
Learn to choose the right base, connect fractions with ratios, and solve percentage and data interpretation questions through fully worked examples.
Updated 14 Aug 20265 min readIISC Administrative Assistant

IISc Administrative Assistant Mock Analysis: Balance Every Section
A total score cannot tell you whether concepts, question selection, speed or guessing caused the loss. Use this worked five-section review to diagnose one mock and plan a balanced repair week.
Updated 11 Aug 20266 min readIISC Administrative Assistant

IISc Administrative Assistant Job Profile: Pay Structure and Office Reality
Understand the IISc Administrative Assistant role through its official job description, an honest pay-matrix reading, and a realistic office-file workflow.
Updated 9 Aug 20265 min readIISC Administrative Assistant

IISc Administrative Assistant English: Build Accuracy for Office Work
Train English accuracy through office-style grammar checks, precise sentence correction, fact retrieval, proofreading and a repeatable practice loop.
Updated 7 Aug 20265 min readIISC Administrative Assistant