CAT Score Normalisation Explained: Raw Score, Percentile and Shortlists
See how a response-sheet raw score becomes a scaled score and percentile, then learn why the same displayed percentile can lead to different shortlist outcomes.
KnowledgeGate Team
Exam prep & CS education
Updated 12 Aug 20265 min read74 views

You calculate a raw score from your CAT response sheet, but the scorecard later shows a different scaled score and a percentile. Raw marks are normalised against session distributions, the scaled score is ranked across candidates, and each institute then applies its own shortlisting rules. Every step is ordinary arithmetic, and every step can separate two candidates who looked identical a step earlier: raw scores eight marks apart can land on one scaled score, and one shared percentile can split into opposite shortlist outcomes.
Raw score, scaled score and percentile answer different questions
A raw score is the response-based total before slot adjustment. A scaled score is the result after the official normalisation process. A percentile compares your rank with the pool of candidates who appeared.
Measure | What it answers | What it is not |
|---|---|---|
Raw score | What the answer-key arithmetic gives | Directly comparable across forms |
Scaled score | Normalised section or total score | A percentage |
Percentile | Relative rank after scaling | Percentage marks |
The official CAT 2025 normalisation notice records that VARC, DILR and QA were scaled separately, and that a scaled score for each section plus a total was published alongside sectional and overall percentiles. The CAT & MBA Entrance Preparation category carries the rest of the CAT and MBA entrance material.
Why CAT normalises scores across test sessions
For CAT 2025, three forms were administered in three sessions. The official notice says normalisation adjusted for location and scale differences across form distributions, then normalised again across sections, before scaled scores became percentiles for shortlisting. Location means the centre of a distribution and scale means its spread.
So scaled score = raw score + fixed slot bonus is wrong. The method used each session's mean, standard deviation and top 0.1% mean raw score, plus the all-session equivalents. Adjustment depends on where a score sits between those anchors, not on an internet difficulty label and not on a flat bonus for whoever sat the harder slot.
CAT slot-scaling formula, worked with illustrative values
Written out, the official section formula is:
scaled = (R - G_slot) × (T_all - G_all) / (T_slot - G_slot) + G_all
Here, R is the raw section score, G = mean + SD, and T is the top 0.1% mean raw score. The official calculation document uses session subscripts and applies this separately to each section.
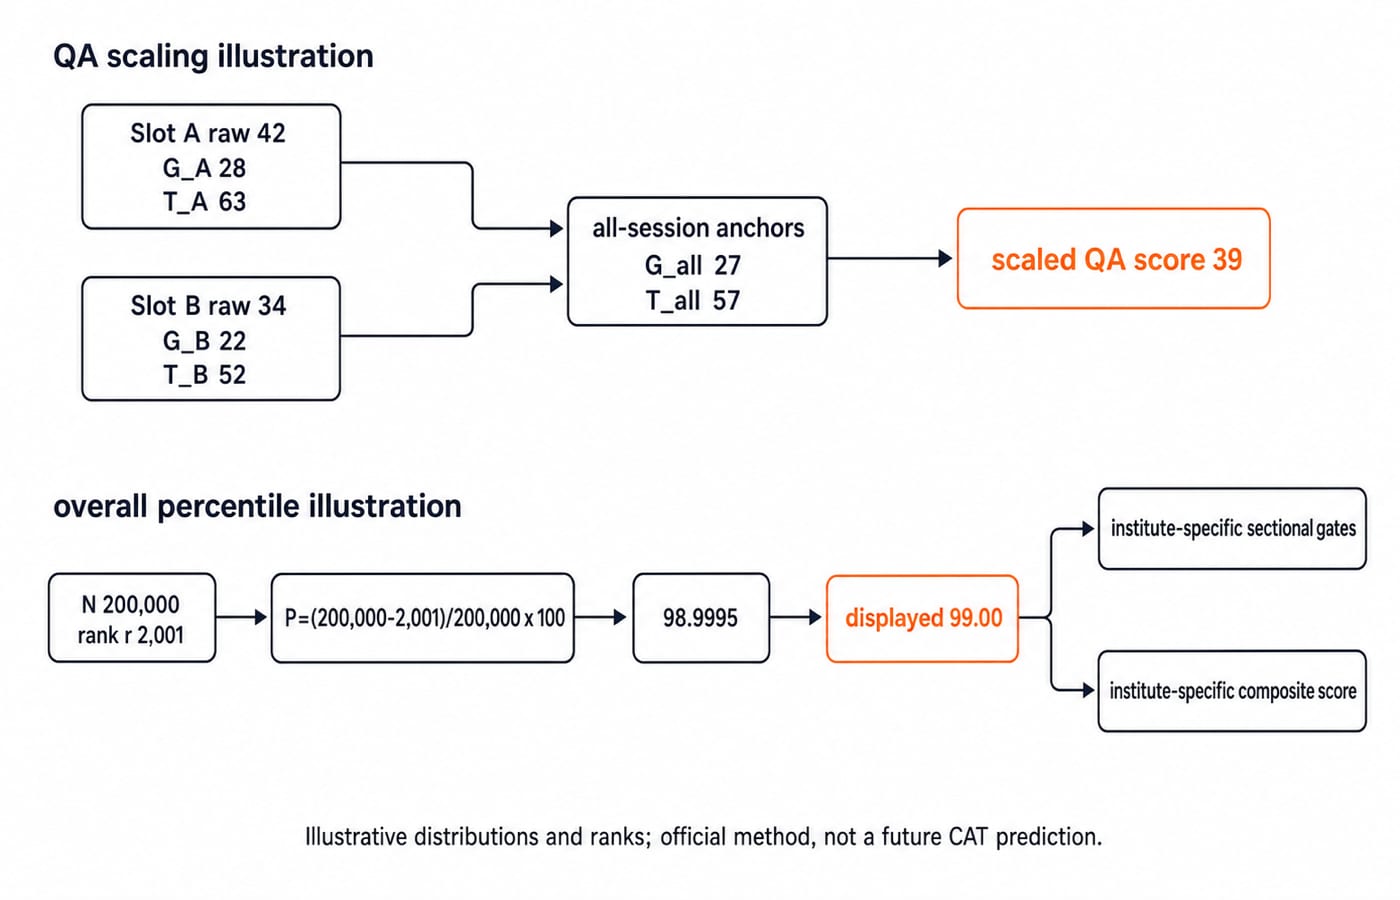
Take an illustrative QA section. Across all sessions, mean = 20, SD = 7, so G_all = 27, while T_all = 57.
Slot A:
mean = 22,SD = 6,G_A = 28,T_A = 63. For rawR = 42, scaled score= (42 - 28) × (57 - 27) / (63 - 28) + 27 = 14 × 30/35 + 27 = 39.Slot B:
mean = 16,SD = 6,G_B = 22,T_B = 52. For rawR = 34, scaled score= (34 - 22) × 30/30 + 27 = 39.
Thus raw 42 and 34 can both scale to 39. Conversely, raw 42 in Slot B gives (42 - 22) × 30/30 + 27 = 47, while it gave 39 in Slot A. Eight raw marks of difference vanish in one direction and eight scaled points appear in the other, purely from which session a candidate sat.
Convert scaled-score rank into percentile, including ties
The official CAT 2025 method ranks candidates by the relevant scaled score, then calculates P = (N - r) / N × 100, where N appeared and r is the candidate's rank.
For illustrative N = 200,000 and r = 2,001:
P = (200,000 - 2,001) / 200,000 × 100 = 98.9995, displayed to two decimals as 99.00.
Candidates with identical scaled scores receive the same rank. If two tie at rank 2,001, both get the same percentile and the next rank is 2,003. At rank 10,001, (200,000 - 10,001) / 200,000 × 100 = 94.9995, displayed as 95.00. A 99.00 percentile describes rank position, not 99% correct answers or maximum marks.
The same overall percentile can hide different sections
Two illustrative scorecards, both reading 99.00 overall:
Candidate | Overall | VARC | DILR | QA |
|---|---|---|---|---|
A | 99.00 | 99.20 | 98.00 | 79.80 |
B | 99.00 | 96.10 | 93.40 | 88.50 |
Overall percentile comes from overall scaled-score rank. It is not the arithmetic mean of sectional percentiles. The same display may reflect a scaled-score tie or distinct percentiles rounding alike. So the overall figure alone says nothing about section balance, and section balance is the first thing many shortlists check.
Why identical percentiles can produce different shortlists
Each IIM sets its own criteria. Academics, relevant work experience, gender and academic diversity, cutoffs and weights all sit alongside CAT performance, and the published conversions differ sharply between institutes, as CAT Profile Factors in IIM Selection works through for the 2026-28 batch.
First, suppose a shortlist gate requires all three sectional percentiles to be at least 80.00. Candidate A fails because QA 79.80 < 80.00. Candidate B passes because the lowest section, QA, is 88.50.
A separate illustrative model puts 100 points on the table. Both candidates receive 63/70 for CAT. Academic points are 0.2 × mean(Class 10%, Class 12%, graduation%), maximum 20. Work points are min(completed months, 24) / 24 × 10.
Candidate A has academics
84, 72, 75and zero work months. Their mean is77, so the total is63 + 0.2 × 77 + 0 = 78.4.Candidate B has academics
92, 91, 84and24work months. Their mean is89, so the total is63 + 0.2 × 89 + 10 = 90.8.
Against an illustrative cutoff of 85, A is below and B is above, on identical overall percentiles.
Read the scorecard in order: the short version
Audit the scorecard in four steps:
Keep the response-sheet raw estimate separate.
Copy the official sectional and overall scaled scores.
Copy all four percentiles without averaging them.
Make one row per target programme with its official policy URL, batch, sectional and overall gates, shortlist formula, evidence fields and later selection stages.
Recheck the institute site because policies are programme-specific and cycle-specific. Raw score measures responses, normalisation creates comparability, percentile expresses rank, and a shortlist adds another policy layer.
If that audit points at quant or reasoning rather than at the scaling, the Aptitude & Reasoning posts cover those skills, and the Mathematics, Aptitude and Reasoning banks together carry over 14,500 practice questions, none of them CAT-specific. The CAT Preparation Course is the structured route through the same sections if you would rather not assemble the plan yourself.
Keep learning

CAT Mock Analysis: Diagnose Time, Accuracy and Question Choice
Turn one mock into a practical review sheet. Separate execution, selection and reach problems, then test one measurable rule per section.
Updated 22 Aug 20265 min readMBA Entrance (CAT)

CAT for Non-Engineers: Build a Quant Foundation Before Chasing Shortcuts
Use this 12-week quant plan to find your real gaps, rebuild core relationships, revisit errors and add timed mixed practice only when the foundation is ready.
Updated 20 Aug 20266 min readMBA Entrance (CAT)

CAT Preparation for Working Professionals: A Sustainable 10-Hour Week
Build a repeatable CAT week around a full-time job, then use completed work and error patterns to decide what the next 600 minutes should contain.
Updated 18 Aug 20266 min readMBA Entrance (CAT)

CAT Quant for Non-Engineers: A 16-Week Foundation Plan Without Shortcuts
Rebuild CAT quant in dependency order: a 24-question diagnostic, a 16-week 160-hour map, an exact 10-hour week, an accuracy gate and a missed-day rule.
Updated 16 Aug 20265 min readMBA Entrance (CAT)