Directions : Read the following bar graph and line chart carefully and answer…
IBPS · 2024
Directions : Read the following bar graph and line chart carefully and answer the questions given below. The bar graph shows total number of balls (Red, Green and Blue) in four different bags. The line graph shows the probability of picking a red ball from bag A and C and the probability of picking green ball from bag B and D each.
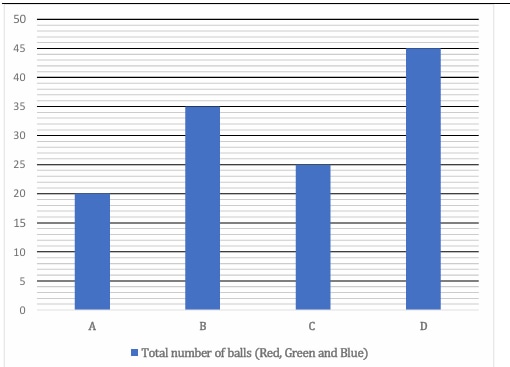
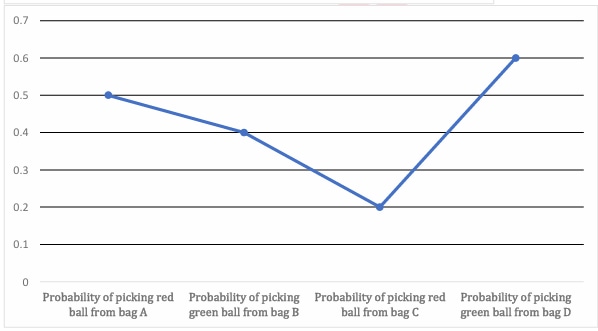
The number of blue balls in bag A is 5 less than the difference between the number of green balls in bags B and D. If the average number of green balls in all four bags is 12, then the difference between the number of blue balls in bag C and the number of green balls in bag A is 'P'. Which of the following option is correct about 'P'.
- A.
P is multiple of 11
- B.
P is a prime number
- C.
Both (b) & (d)
- D.
65 is completely divisible by P
- E.
Both (a) & (b)
Attempted by 6 students.
Show answer
Correct answer: C