The table below provides data on the number of candidates who appeared (A) and…
2020
The table below provides data on the number of candidates who appeared (A) and qualified (Q) in a test during the years from 2014 to 2019 from five different zones J, K, L, M and N. In accordance with the table, answer the questions.
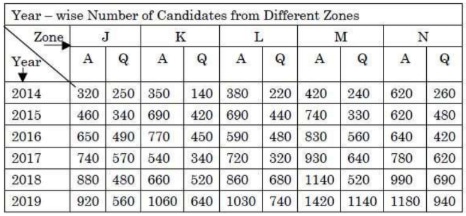
Ques: The ratio of the number of candidates who appeared in the test from Zone-J in the year 2014 to the number of candidates who qualified the test from Zone-M in the year 2016 was:
Answer: A. 4 : 7 — ConceptA ratio compares two quantities of the same kind by division, written a : b, and is then reduced to its lowest terms by dividing both parts by their…
- A.
4 : 7
- B.
4 : 9
- C.
9 : 4
- D.
8 : 13
Attempted by 4 students.
Show answer & explanation
Correct answer: A
Concept
A ratio compares two quantities of the same kind by division, written a : b, and is then reduced to its lowest terms by dividing both parts by their greatest common divisor (HCF).
In a two-way (year x zone) data table, each value is located by intersecting the correct ROW (year) with the correct COLUMN, and within a zone you must pick the right sub-column: A = appeared, Q = qualified. Reading the wrong sub-column or the wrong year is the usual error.
Application
Required first quantity: candidates who APPEARED (A) from Zone-J in 2014. Read row 2014, column J, sub-column A = 320.
Required second quantity: candidates who QUALIFIED (Q) from Zone-M in 2016. Read row 2016, column M, sub-column Q = 560.
Form the ratio in the asked order: 320 : 560.
Reduce: HCF(320, 560) = 80, so 320/80 : 560/80 = 4 : 7.
Cross-check
Multiply the reduced ratio back by the common factor 80: 4 x 80 = 320 and 7 x 80 = 560, which restores the two original table values, confirming 4 : 7.