The table below provides data on the number of candidates who appeared (A) and…
2020
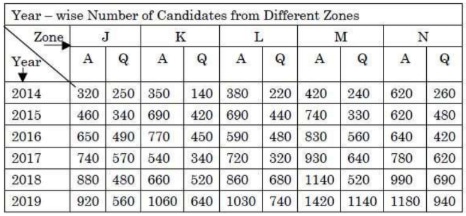
The table below provides data on the number of candidates who appeared (A) and qualified (Q) in a test during the years from 2014 to 2019 from five different zones J, K, L, M and N. In accordance with the table, answer the questions.
Ques: What was the average number of candidates who appeared in the test from Zone-N over all the years together?
- A.
810
- B.
815
- C.
825
- D.
805
Show answer & explanation
Correct answer: D
Concept
The arithmetic mean (average) of a set of values is the sum of all the values divided by the count of values: average = (sum of all observations) / (number of observations). For a year-wise table, read only the relevant column for the required zone, add the entries across all the years, then divide by the number of years.
Application
We need the average number of candidates who appeared (the A column) from Zone-N across the six years 2014 to 2019. From the table, the Zone-N "A" entries are 620, 620, 640, 780, 990 and 1180. The working, one step per line:
Add the six A-column entries: 620 + 620 + 640 + 780 + 990 + 1180 = 4830.
Count the years: there are 6 years from 2014 to 2019 inclusive.
Divide the total by the number of years: 4830 / 6 = 805.
Cross-check
Verify the division: 6 x 805 = 4830, which matches the total, so 805 is exact with no remainder. Pairing the entries also confirms the total: (620 + 1180) + (620 + 990) + (640 + 780) = 1800 + 1610 + 1420 = 4830, and 4830 / 6 = 805. Both routes give 805.