The table below provides data on the number of candidates who appeared (A) and…
2020
The table below provides data on the number of candidates who appeared (A) and qualified (Q) in a test during the years from 2014 to 2019 from five different zones J, K, L, M and N. In accordance with the table, answer the questions.
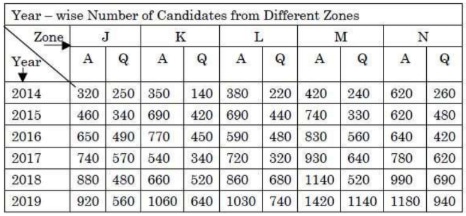
Ques: The difference between the number of candidates who appeared and qualified in the test from Zone-M in the given period was the second lowest in the year:
- A.
2014
- B.
2016
- C.
2017
- D.
2019
Show answer & explanation
Correct answer: B
Concept
In a data-interpretation table the "difference between appeared (A) and qualified (Q)" for any year is simply A minus Q. To find which year has the second lowest difference, compute this gap for every year for the required zone, then sort the gaps in ascending order: the smallest gap is the lowest, and the next one above it is the "second lowest".
Application (Zone-M)
Read the Appeared (A) and Qualified (Q) figures for Zone-M from the table and take A − Q for each year:
2014: 420 − 240 = 180
2015: 740 − 330 = 410
2016: 830 − 560 = 270
2017: 930 − 640 = 290
2018: 1140 − 520 = 620
2019: 1420 − 1140 = 280
Cross-check (rank the gaps)
Sort the six gaps from smallest to largest:
Rank | Year | A − Q |
|---|---|---|
Lowest | 2014 | 180 |
2nd lowest | 2016 | 270 |
3rd | 2019 | 280 |
4th | 2017 | 290 |
5th | 2015 | 410 |
6th | 2018 | 620 |
The lowest gap is 180 (in 2014); the very next gap above it is 270, so the second lowest difference for Zone-M occurs in 2016. Note 2016 (270) and 2019 (280) differ by only 10, so the figures must be read carefully.
Result
The difference between appeared and qualified candidates from Zone-M was the second lowest in 2016.