The pie chart (i) given below shows percentage distribution of total people…
2023
The pie chart
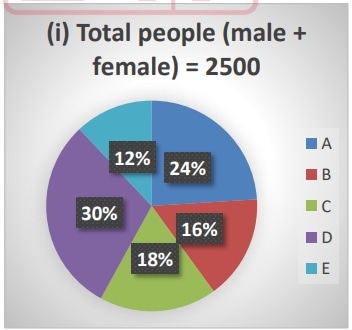
(i) given below shows percentage distribution of total people (male + female) visited five different clubs and pie chart
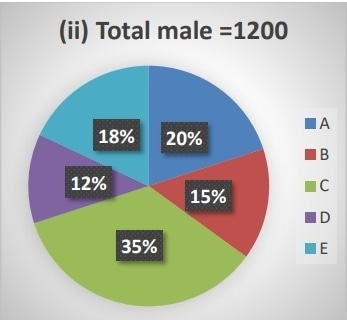
(ii) shows percentage distribution of total male visited in these five clubs. Read the data carefully and answer the questions given below.
If price of each visit pass for club A, B and E is Rs 150, Rs 200 & Rs. 250 respectively, then find the total revenue (in Rs) generated in these clubs by all the males visited.
Answer: C. 126000 — Concept: In a two-pie data set, the share of a category in a pie applies to that pie's own grand total. The male count in a club is found from pie (ii) [Total…
- A.
108000
- B.
136000
- C.
126000
- D.
96000
- E.
156000
Attempted by 10 students.
Show answer & explanation
Correct answer: C
Concept: In a two-pie data set, the share of a category in a pie applies to that pie's own grand total. The male count in a club is found from pie (ii) [Total male], not pie (i) [Total people]; multiply each category's percentage by 1200. Revenue from a club is (number of males in that club) × (pass price of that club), and the asked total is the sum over the clubs A, B and E only.
Step 1 — Read the male counts from pie (ii), where Total male = 1200:
Males in A = 20% of 1200 = 240
Males in B = 15% of 1200 = 180
Males in E = 18% of 1200 = 216
Step 2 — Multiply each male count by that club's pass price (A: Rs 150, B: Rs 200, E: Rs 250):
Revenue from A = 240 × 150 = Rs 36,000
Revenue from B = 180 × 200 = Rs 36,000
Revenue from E = 216 × 250 = Rs 54,000
Step 3 — Add the three club revenues:
Total = 36,000 + 36,000 + 54,000 = Rs 1,26,000.
Cross-check: Pie (i) and its total of 2500 are not used here — the question asks only about males, so only the male pie (1200) drives the counts. The combined male share of A, B and E is 20% + 15% + 18% = 53% of 1200 = 636 males, and the weighted price mix gives Rs 1,26,000, confirming the result.