The pie chart (i) given below shows percentage distribution of total people…
2023
The pie chart
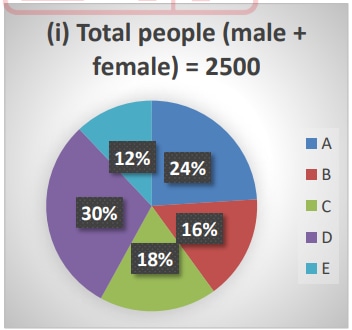
(i) given below shows percentage distribution of total people (male + female) visited five different clubs and pie chart
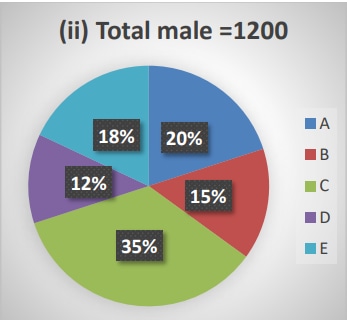
(ii) shows percentage distribution of total male visited in these five clubs. Read the data carefully and answer the questions given below.
Total females visited club B and C together are what percent of total people visited club D.
Answer: D. 33.33% — ConceptFor each club, the number of females equals the total people in that club minus the number of males in that club: females = people − males. Each pie's…
- A.
40%
- B.
35%
- C.
36.3%
- D.
33.33%
- E.
30%
Attempted by 10 students.
Show answer & explanation
Correct answer: D
Concept
For each club, the number of females equals the total people in that club minus the number of males in that club: females = people − males. Each pie's percentages are taken on its OWN base — pie (i) on 2500 total people, pie (ii) on 1200 total males — so always convert a percentage to an absolute count on the correct base before combining the two charts.
Application
People in each club (base 2500): B = 16% of 2500 = 400, C = 18% of 2500 = 450, D = 30% of 2500 = 750.
Males in each club (base 1200): B = 15% of 1200 = 180, C = 35% of 1200 = 420.
Females in B = 400 − 180 = 220. Females in C = 450 − 420 = 30. Females in B and C together = 220 + 30 = 250.
Required percentage = (females in B and C) ÷ (people in D) × 100 = 250 ÷ 750 × 100 = 33.33%.
Cross-check
Total females overall = 2500 − 1200 = 1300; the female counts across the five clubs (360 + 220 + 30 + 606 + 84) sum to 1300, confirming the per-club female figures are consistent. Also 250 ÷ 750 = 1/3 exactly, which is 33.33% — matching the computed value.