The pie charts depict the shares of various power generation technologies in…
GATE · 2024 · CS · Set 2 · General AptitudeGATE · 2024 · ST · General AptitudeGATE · 2024 · XE · General AptitudeGATE · 2024 · XL · General Aptitude
The pie charts depict the shares of various power generation technologies in the total electricity generation of a country for the years 2007 and 2023.
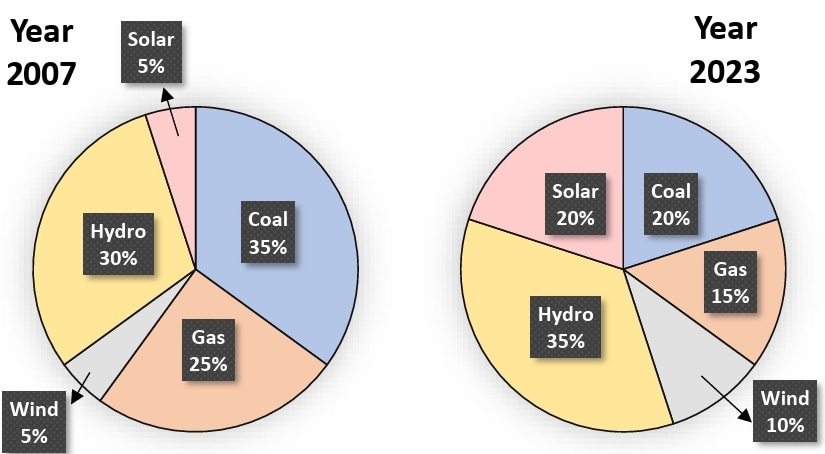
The renewable sources of electricity generation consist of Hydro, Solar and Wind. Assuming that the total electricity generated remains the same from 2007 to 2023, what is the percentage increase in the share of the renewable sources of electricity generation over this period?
- A.
25%
- B.
50%
- C.
77.5%
- D.
62.5%
Attempted by 78 students.
Show answer
Correct answer: D
The worked solution is available to enrolled students.
Video solution available to enrolled students.
Explore the full course: Iocl Engineers Officer Grade A Paper 1