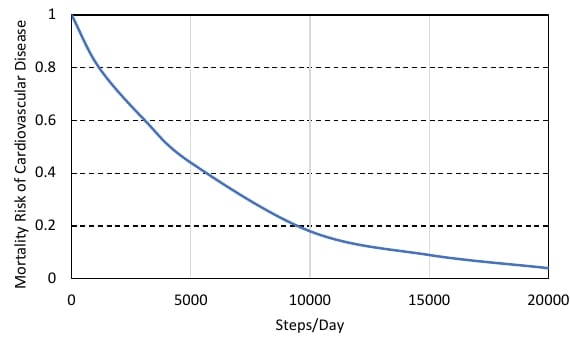
The plot below shows the relationship between the mortality risk of…
GATE · 2024 · CE · Set 2 · General AptitudeGATE · 2024 · IN · General AptitudeGATE · 2024 · MA · General AptitudeGATE · 2024 · MN · General AptitudeGATE · 2024 · PE · General Aptitude
The plot below shows the relationship between the mortality risk of cardiovascular disease and the number of steps a person walks per day. Based on the data, which one of the following options is true?
- A.
The risk reduction on increasing the steps/day from 0 to 10000 is less than the risk reduction on increasing the steps/day from 10000 to 20000.
- B.
The risk reduction on increasing the steps/day from 0 to 5000 is less than the risk reduction on increasing the steps/day from 15000 to 20000.
- C.
For any 5000 increment in steps/day the largest risk reduction occurs on going from 0 to 5000.
- D.
For any 5000 increment in steps/day the largest risk reduction occurs on going from 15000 to 20000.
Attempted by 4 students.
Show answer
Correct answer: C
Explore the full course: Iocl Engineers Officer Grade A Paper 1