The following line graph shows the ratio of the amounts of imports by a…
2024
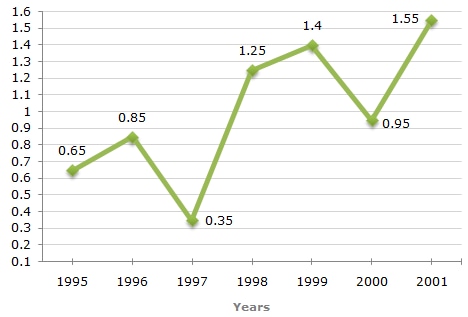
The following line graph shows the ratio of the amounts of imports by a Company to the amount of exports from that Company over the period from 1995 to 2001. The questions given below are based on this graph.
Ratio of value of Import to Export by a Company over the Years
If the imports in 1998 were Rs. 250 crores and the total exports in the years 1998 and 1999 together were Rs. 500 crores, what was the amount of imports in 1999?
Answer: D. Rs. 420 crores — Concept: For a line graph that plots the import-to-export ratio for each year, the ratio always equals imports divided by exports for that year. So whenever…
- A.
Rs. 250 crores
- B.
Rs. 300 crores
- C.
Rs. 357 crores
- D.
Rs. 420 crores
Attempted by 4 students.
Show answer & explanation
Correct answer: D
Concept: For a line graph that plots the import-to-export ratio for each year, the ratio always equals imports divided by exports for that year. So whenever one of the two quantities (imports or exports) is known for a year along with its ratio, the other quantity can be found directly: exports equal imports divided by the ratio, and imports equal exports multiplied by the ratio.
From the graph, the import-to-export ratio for 1998 is 1.25 and for 1999 is 1.40.
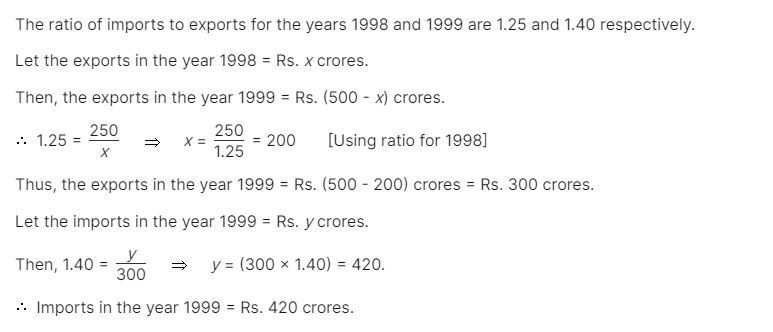
The imports in 1998 are given as Rs. 250 crores, so the exports in 1998 = 250 ÷ 1.25 = Rs. 200 crores.
The combined exports for 1998 and 1999 are given as Rs. 500 crores, so the exports in 1999 = 500 − 200 = Rs. 300 crores.
Applying the 1999 ratio to the 1999 exports gives the imports in 1999 = 300 × 1.40 = Rs. 420 crores.
Cross-check: dividing the computed 1999 imports by the computed 1999 exports gives 420 ÷ 300 = 1.40, which matches the 1999 ratio read from the graph, confirming the answer.
Therefore, the imports in 1999 were Rs. 420 crores.