The following line graph gives the ratio of the amounts of imports by a…

2024

The following line graph gives the ratio of the amounts of imports by a company to the amount of exports from that company over the period from 1995 to 2001.

Ratio of value of Import to Exports by a Company Over the Years:
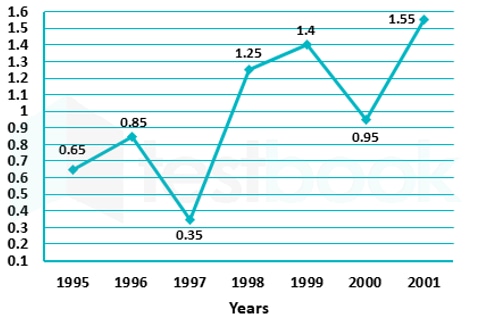
image.png

What was the percentage increase in imports from 1997 to 1998?

  1. A.

    72

  2. B.

    56

  3. C.

    28

  4. D.

    Data inadequate

Attempted by 24 students.

Show answer & explanation

Correct answer: D

Key insight: the graph gives ratios of imports to exports, not absolute import or export amounts.

  • Read the ratios from the graph: ratio in 1997 = 0.35, ratio in 1998 = 1.25.

  • Express imports in terms of exports: I1997 = 0.35 × E1997 and I1998 = 1.25 × E1998, where E1997 and E1998 are the export amounts.

  • Percentage increase in imports = (I1998 − I1997)/I1997 × 100 = (1.25·E1998 − 0.35·E1997)/(0.35·E1997) × 100.

  • Because E1997 and E1998 are not given, this expression cannot be evaluated numerically from the information in the graph.

  • Conclusion: The data are inadequate to find the percentage increase in imports from 1997 to 1998 without additional information about export amounts. (For reference: if exports were assumed unchanged, the imports would increase by (1.25 − 0.35)/0.35 × 100 ≈ 257.14%.)

Explore the full course: Infosys Preparation