The following line graph gives the ratio of the amounts of imports by a…

2024

The following line graph gives the ratio of the amounts of imports by a company to the amount of exports from that company over the period from 1995 to 2001.

Ratio of value of Import to Exports by a Company Over the Years:
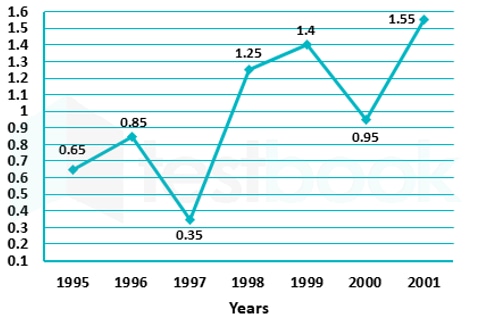
image.png

If the imports in 1998 was Rs. 250 crores and the total exports in the years 1998 and 1999 together was Rs. 500 crores, then the imports in 1999 was

  1. A.

    Rs. 250 crores

  2. B.

    Rs. 300 crores

  3. C.

    Rs. 357 crores

  4. D.

    Rs. 420 crores

Attempted by 42 students.

Show answer & explanation

Correct answer: D

Solution outline:

  1. From the graph the import/export ratio in 1998 is 1.25 and in 1999 is 1.4. The imports in 1998 are given as Rs. 250 crores. The total exports in 1998 and 1999 together are Rs. 500 crores.

  2. Find exports in 1998: ratio = imports₉₈ / exports₉₈ = 1.25, so exports₉₈ = 250 / 1.25 = 200 crores.

  3. Find exports in 1999: total exports = 500, so exports₉₉ = 500 − 200 = 300 crores.

  4. Find imports in 1999: imports₉₉ = (import/export ratio in 1999) × exports₉₉ = 1.4 × 300 = 420 crores.

  5. Answer: Imports in 1999 = Rs. 420 crores

Explore the full course: Infosys Preparation