The following line graph gives the ratio of the amounts of imports by a…
2024
The following line graph gives the ratio of the amounts of imports by a company to the amount of exports from that company over the period from 1995 to 2001.
Ratio of value of Import to Exports by a Company Over the Years:
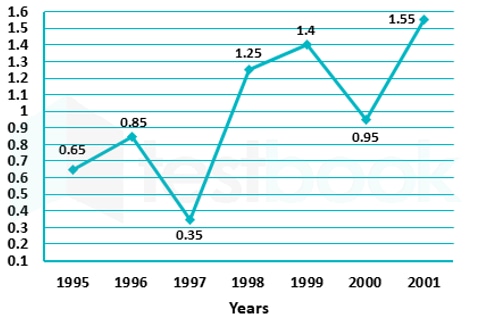
The imports were minimum proportionate to exports of the company in the year
Answer: C. 1997 — Key insight: find the year with the lowest import-to-export ratio on the graph. 1995: 0.65 1996: 0.85 1997: 0.35 1998: 1.25 1999: 1.40 2000: 0.95 2001: 1.55…
- A.
1995
- B.
1996
- C.
1997
- D.
2000
Attempted by 77 students.
Show answer & explanation
Correct answer: C
Key insight: find the year with the lowest import-to-export ratio on the graph.
1995: 0.65
1996: 0.85
1997: 0.35
1998: 1.25
1999: 1.40
2000: 0.95
2001: 1.55
Conclusion: The minimum import-to-export ratio is 0.35, which occurs in 1997. Therefore, imports were minimum proportionate to exports in 1997.
Answer: 1997