The Venn diagram shows the preference of the student population for leisure…
GATE · 2016 · ME · Set 3 · General Aptitude
The Venn diagram shows the preference of the student population for leisure activities.
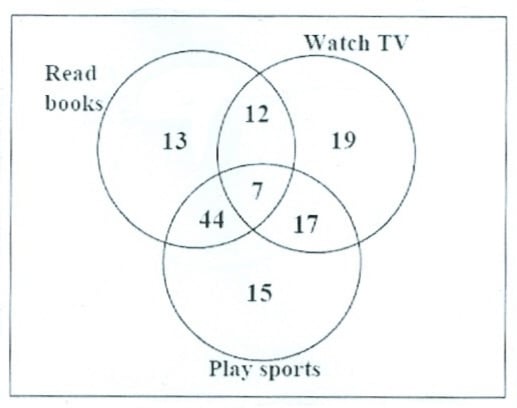
From the data given, the number of students who like to read books or play sports is _____.
- A.
44
- B.
51
- C.
79
- D.
108
Attempted by 1 students.
Sign up free to check your answer
Sign up freeLoading lesson…