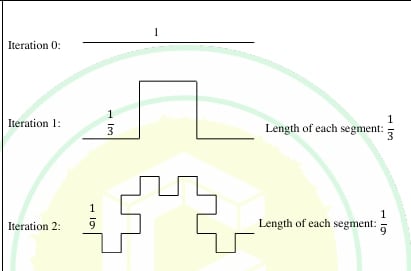
The following figures show three curves generated using an iterative…
GATE · 2025 · BM · General AptitudeGATE · 2025 · EC · General AptitudeGATE · 2025 · EY · General AptitudeGATE · 2025 · GE · General AptitudeGATE · 2025 · XH · General Aptitude
The following figures show three curves generated using an iterative algorithm. The total length of the curve generated after ‘Iteration ’ is:
Note: The figures shown are representative.
- A.
- B.
- C.
- D.
Attempted by 2 students.
Sign up free to check your answer
Sign up freeLoading lesson…