The figure in Panel I is a 4×4 grid. The numbers on the top and left represent…
GATE · 2026 · CS · Set 2 · General AptitudeGATE · 2026 · EY · General AptitudeGATE · 2026 · NM · General AptitudeGATE · 2026 · PE · General Aptitude
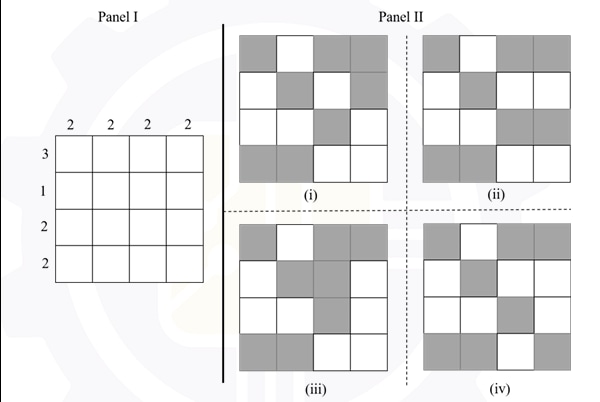
The figure in Panel I is a 4×4 grid.
The numbers on the top and left represent the number of cells to be shaded in that column and row respectively.
Which one of the options in Panel II represents the correctly shaded grid?
- A.
(i)
- B.
(ii)
- C.
(iii)
- D.
(iv)
Attempted by 204 students.
Sign up free to check your answer
Sign up freeLoading lesson…